Fig. 7
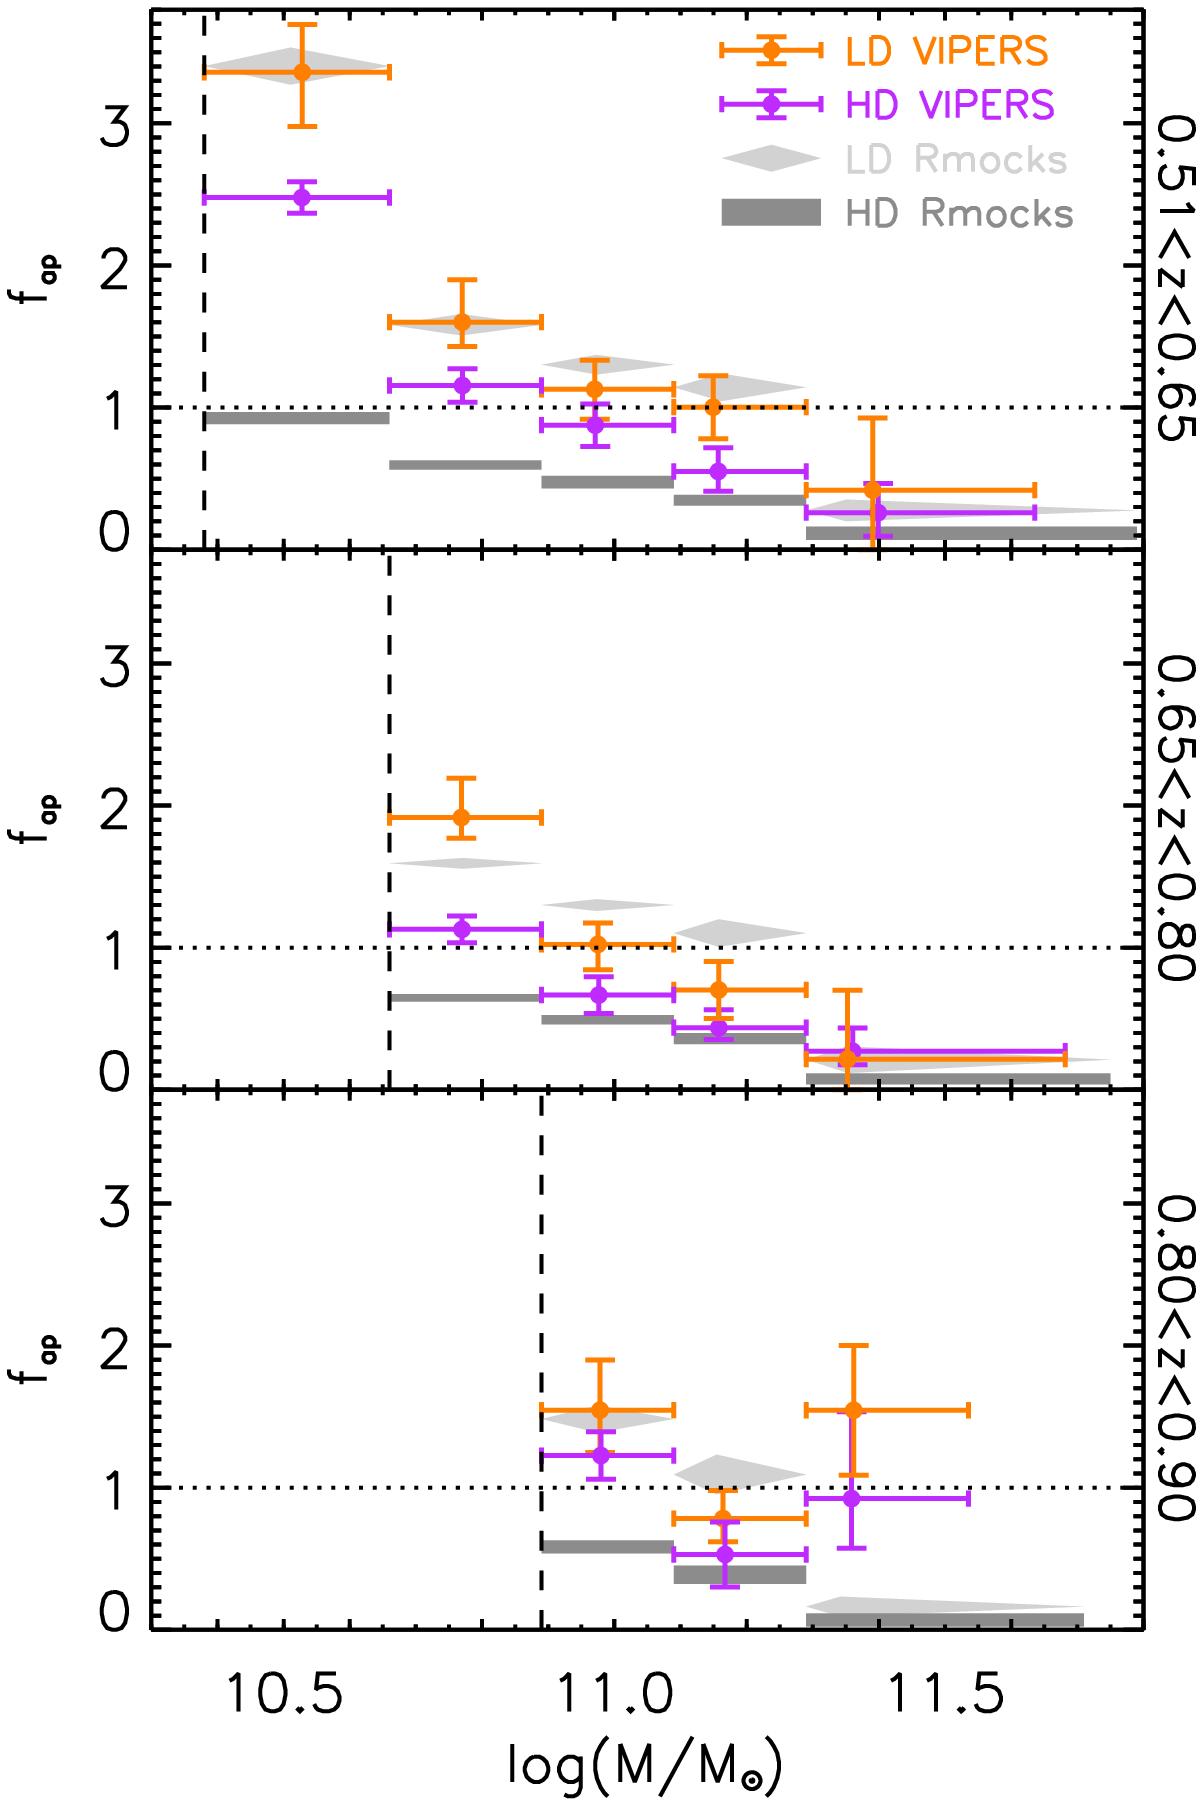
Ratio of the number of active over passive galaxies (fap) in VIPERS real data (orange and violet symbols) and in the Rmocks (filled rectangles and diamonds). The points for the Rmocks are the same as in Fig. 6. The points for the VIPERS sample are taken from Fig. 5, but for the sake of simplicity, in each mass bin for the environment with more galaxies (LD for log (ℳ/ℳ⊙) < 11.29, HD otherwise) we plot only fap as derived from the mass-matched samples, instead of also plotting the original value as in Fig. 5.
Current usage metrics show cumulative count of Article Views (full-text article views including HTML views, PDF and ePub downloads, according to the available data) and Abstracts Views on Vision4Press platform.
Data correspond to usage on the plateform after 2015. The current usage metrics is available 48-96 hours after online publication and is updated daily on week days.
Initial download of the metrics may take a while.