Fig. 6
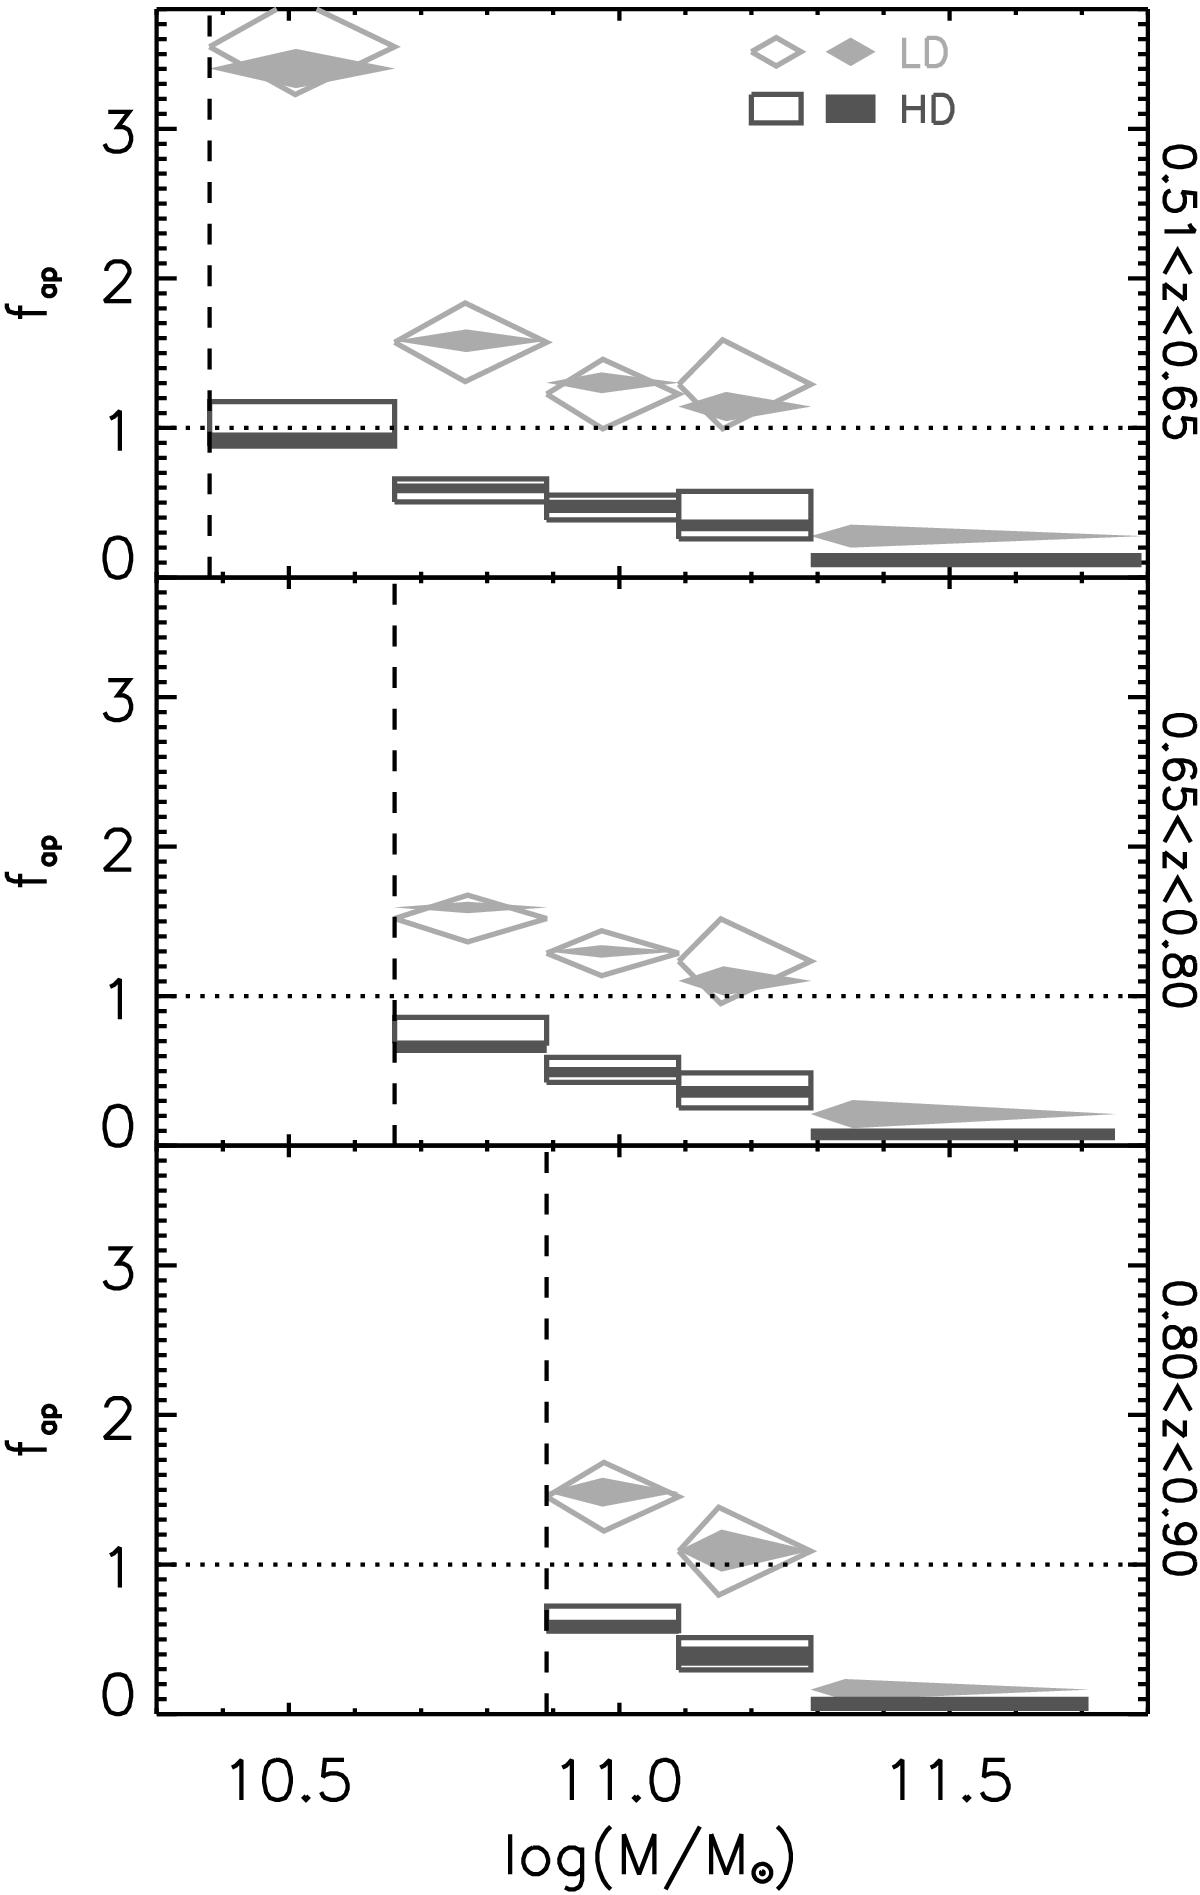
Ratio of the number of active over passive galaxies (fap) in LD (light grey) and HD (dark grey) regions in the Rmocks (filled symbols) and in the Vmocks (empty symbols) in the same stellar mass bins and redshift ranges as in Fig. 5. In each mass bin, for the environment with fewer galaxies (HD for log (ℳ/ℳ⊙) < 11.29, LD otherwise) we plot fap as computed directly from the mock catalogues, while for the environment with more galaxies we plot fap derived from the mass-matched samples. For not mass-matched values, symbols are centred on the y-axis on the mean value of fap of the 16 mock catalogues, and their height represents the rms around the mean. For mass-matched values, the y-axis position is computed as follows: first we compute the mean fap of the 100 mass-matched samples in each mock catalogue, then we average the 16 mean values. The height is given by the rms around this mean. For all symbols, the extension on the x-axis indicates the span of the stellar mass bin. For log (ℳ/ℳ⊙) > 11.29, we show fap only for the Rmocks because the statistics in the Vmocks at these stellar masses is too low (see text). In each panel, the vertical and horizontal lines are the same as in Fig. 5.
Current usage metrics show cumulative count of Article Views (full-text article views including HTML views, PDF and ePub downloads, according to the available data) and Abstracts Views on Vision4Press platform.
Data correspond to usage on the plateform after 2015. The current usage metrics is available 48-96 hours after online publication and is updated daily on week days.
Initial download of the metrics may take a while.