Fig. 5
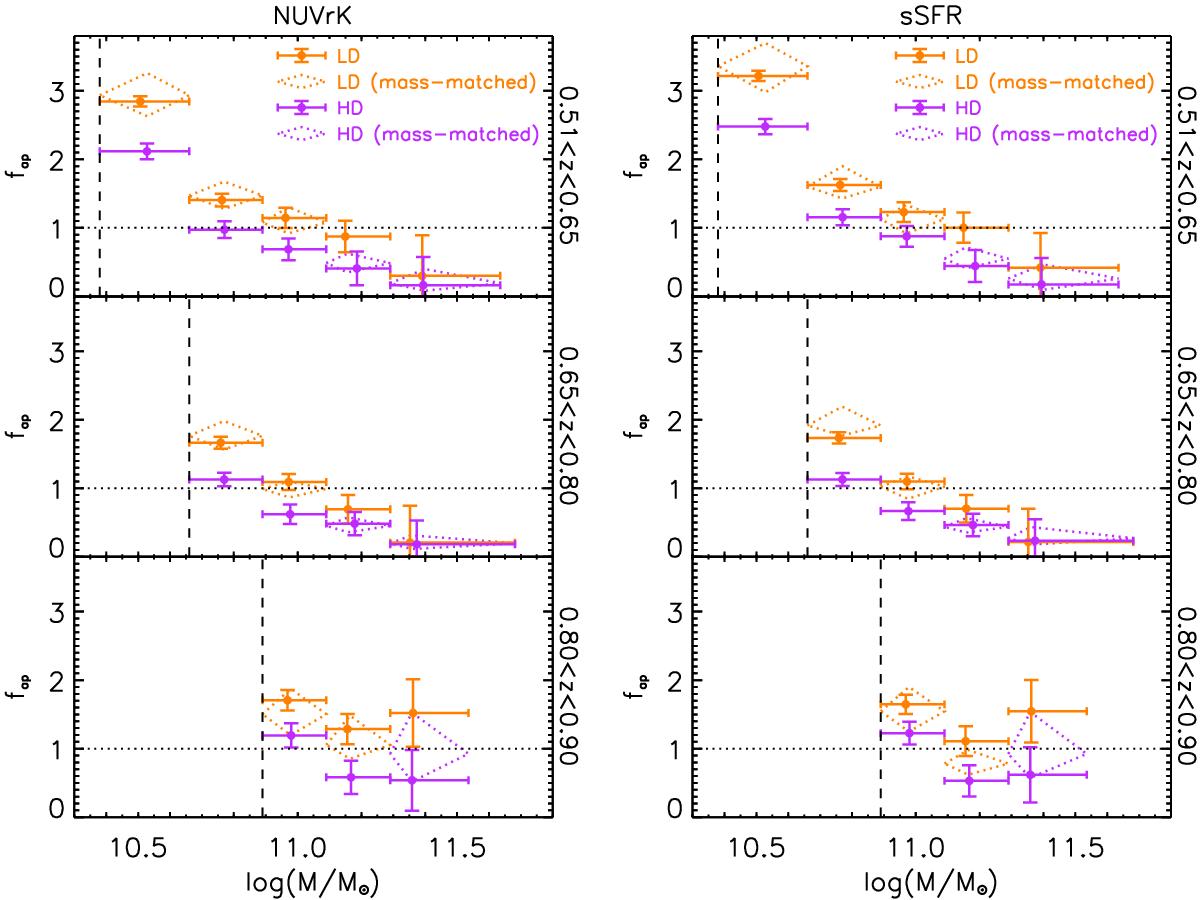
Ratio of the number of active over passive galaxies (fap) in LD (orange filled circles) and HD (violet filled circles) regions as a function of stellar mass in three different redshift bins. Active and passive galaxies are defined by means of the NUVrK diagram (left) or according to their sSFR (right). Horizontal error bars indicate the span of the mass bin, and the vertical error bars are derived from the propagation of the Poissonian noise in the counts of active and passive galaxies (if we use the error formula for small samples suggested in Gehrels (1986), the error bars do not change significantly). The x-axis value is the median stellar mass of the sample used to compute fap. Dotted diamonds are for the mass-matched samples in the environment (LD or HD) with more galaxies in each mass and redshift bin. Diamonds are centred on the median fap value of the 100 mass-matched extractions, and the bottom and top vertices represent the 25% and 75% of the fap distribution, respectively. The x-axis values is the median of the median stellar mass in each extraction. See text for more details. The vertical dashed line in each redshift bin is the corresponding mass limit ℳlim. The dotted horizontal line at fap = 1 is for reference.
Current usage metrics show cumulative count of Article Views (full-text article views including HTML views, PDF and ePub downloads, according to the available data) and Abstracts Views on Vision4Press platform.
Data correspond to usage on the plateform after 2015. The current usage metrics is available 48-96 hours after online publication and is updated daily on week days.
Initial download of the metrics may take a while.