Fig. 4
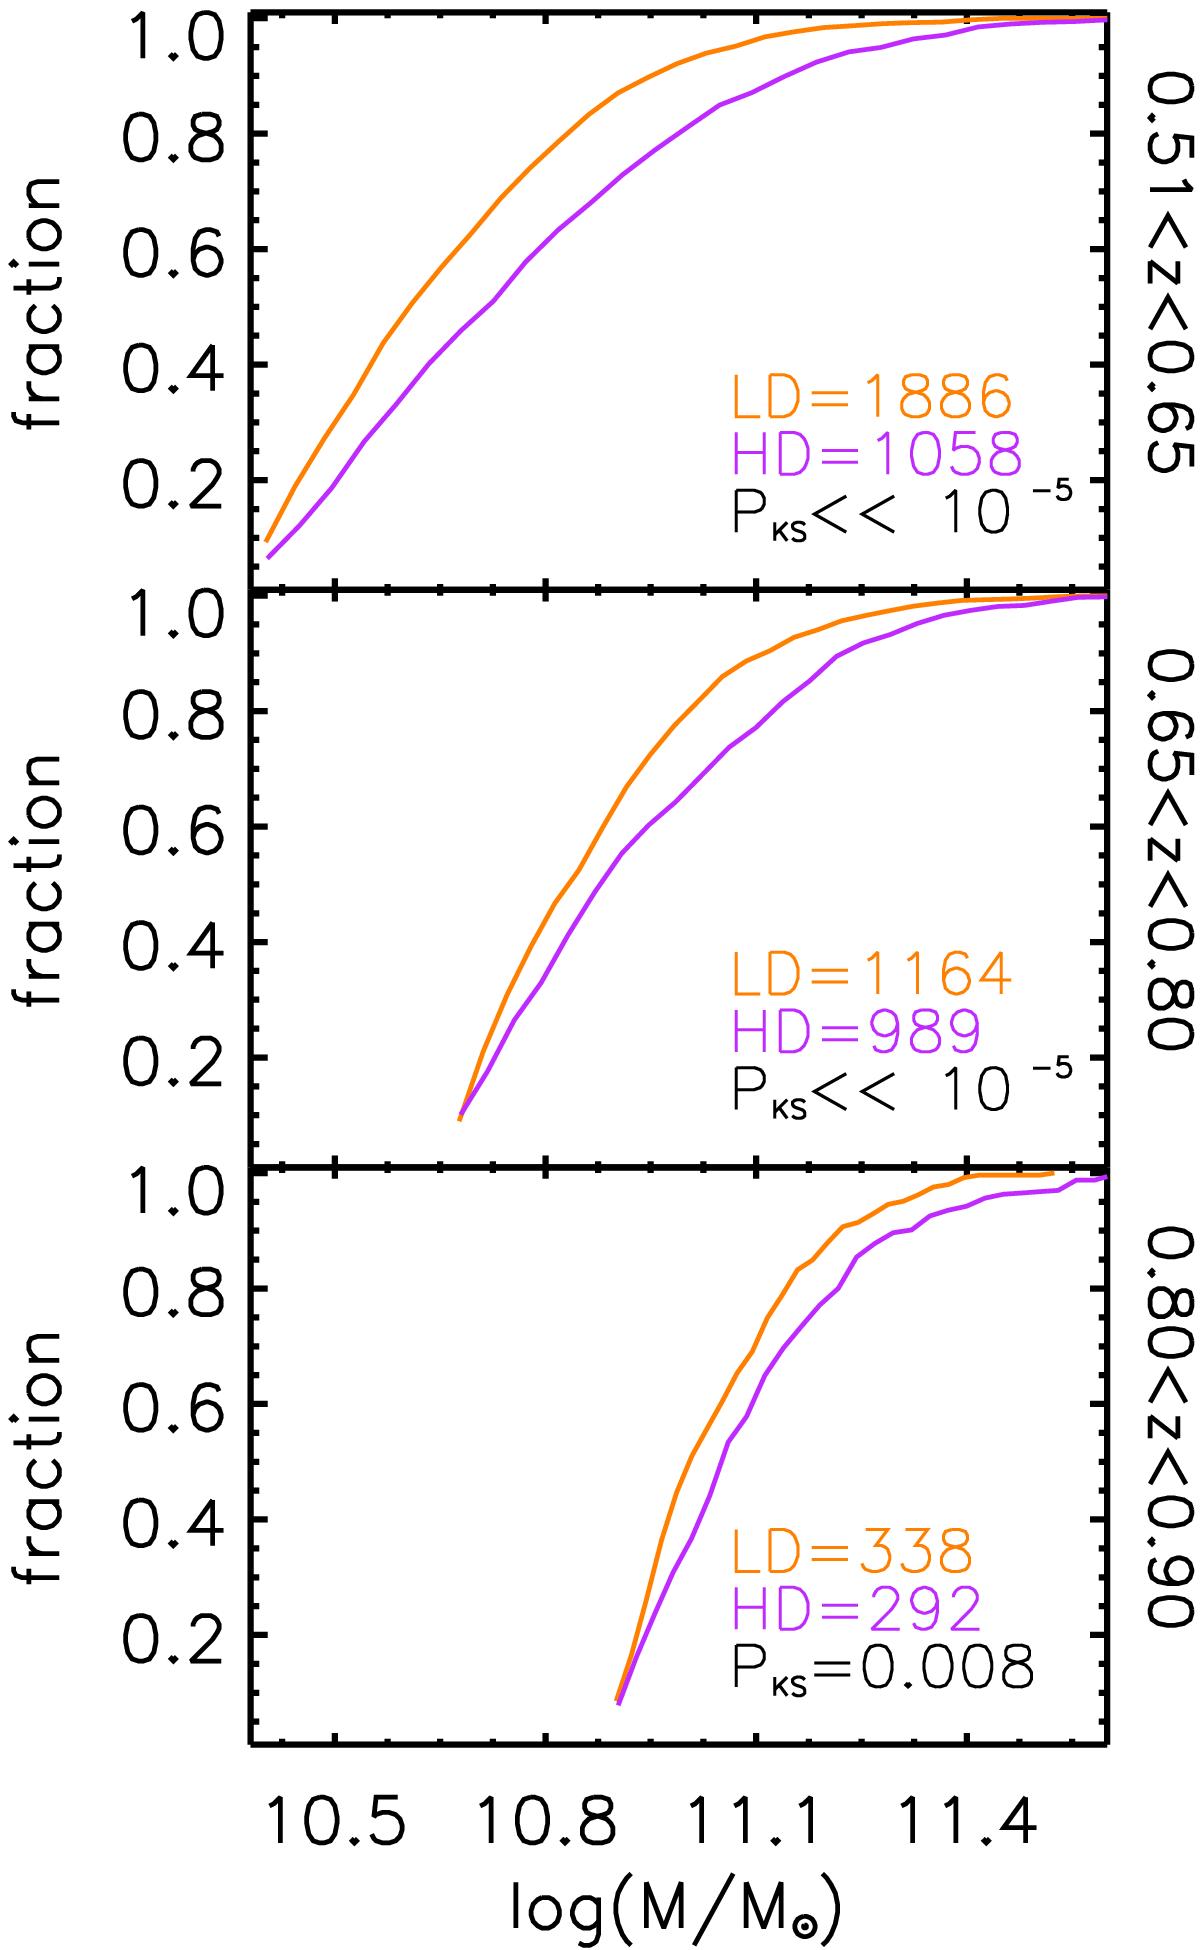
Stellar mass cumulative distributions in three redshift bins (0.51 <z ≤ 0.65, 0.65 <z ≤ 0.8, and 0.8 <z ≤ 0.9from top to bottom), for galaxies above the mass limits log (ℳlim/ ℳ⊙) = 10.38, 10.66, and 10.89, respectively, in the three redshift bins. Orange lines show the galaxies in LD regions, and violet lines show galaxies in HD regions. The number of galaxies used in each distribution is reported in the corresponding panel. We use all the galaxies above the mass limit, regardless of their NUVrK classification. In each panel we also report the PKS values, i.e. the significance level in a Kolmogorov-Smirnov test for the null hypothesis that the LD and HD distributions are drawn from the same parent distribution.
Current usage metrics show cumulative count of Article Views (full-text article views including HTML views, PDF and ePub downloads, according to the available data) and Abstracts Views on Vision4Press platform.
Data correspond to usage on the plateform after 2015. The current usage metrics is available 48-96 hours after online publication and is updated daily on week days.
Initial download of the metrics may take a while.