Fig. 9
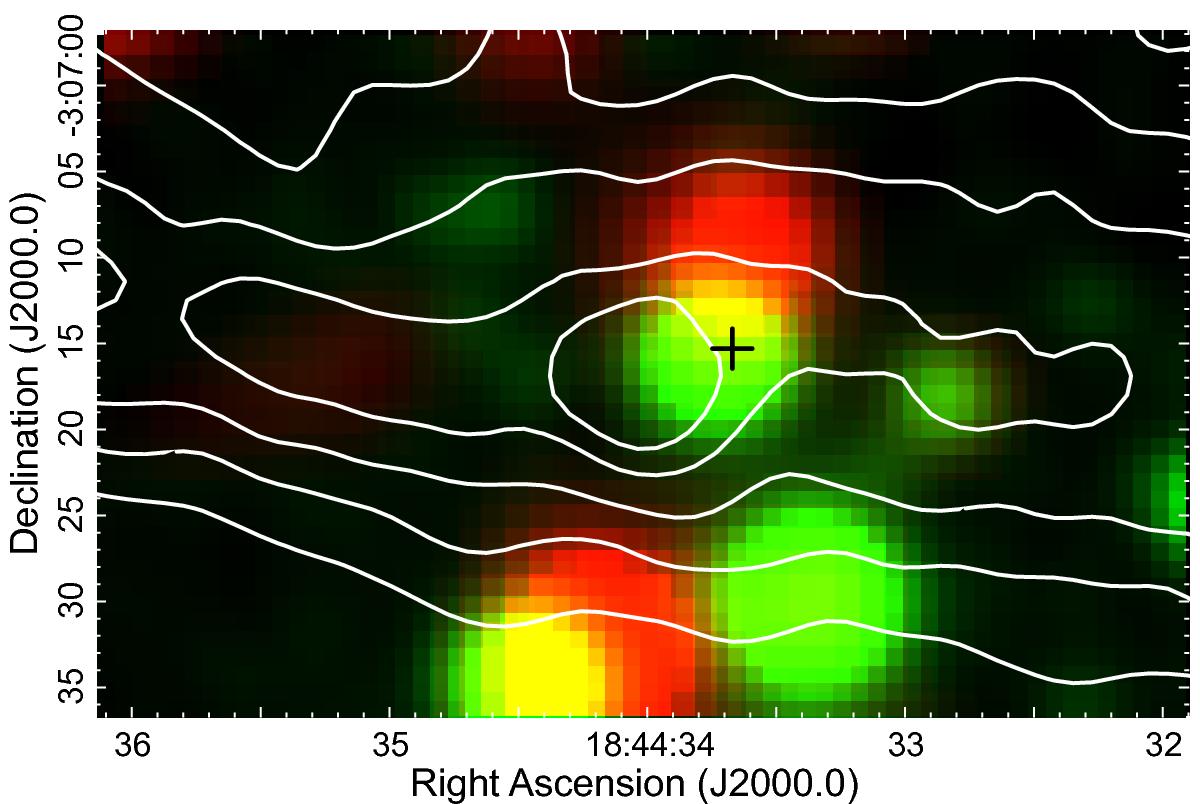
Close-up vision of the central region in G29.37+0.1. The radio emission at 610 MHz is shown as contours, starting at nine times that of the local noise and increasing by a factor of 3.3. The radio contours are overlaid on the 3.4 μm infrared (W1 band, in red) and optical (in green) fields taken from WISE (FWHM ~ 6′′) and DSS (resolution 1′′/pixel). The position of the 2MASS object J18443367−0307153, the possible infrared counterpart to both the DSS optical and WISE emission, is marked with a plus symbol.
Current usage metrics show cumulative count of Article Views (full-text article views including HTML views, PDF and ePub downloads, according to the available data) and Abstracts Views on Vision4Press platform.
Data correspond to usage on the plateform after 2015. The current usage metrics is available 48-96 hours after online publication and is updated daily on week days.
Initial download of the metrics may take a while.