Fig. 5
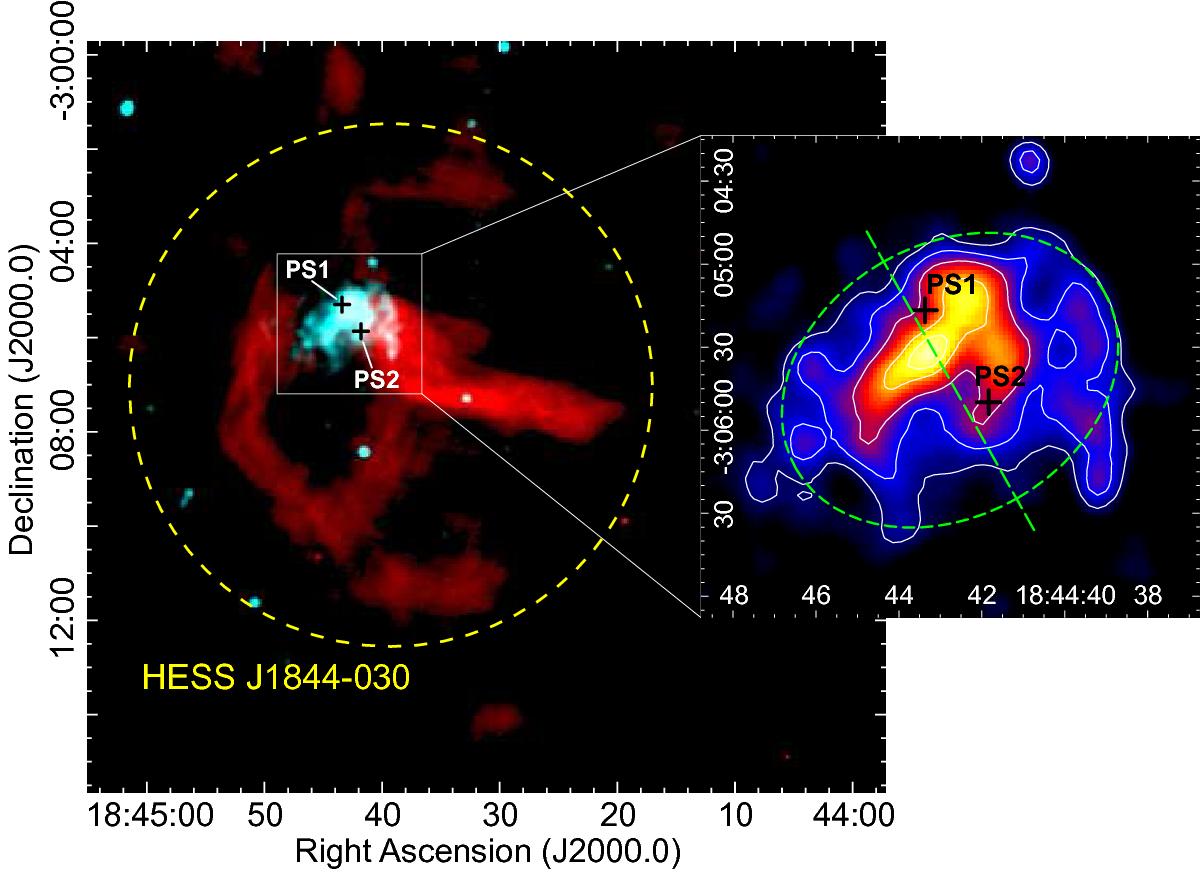
Colour image comparing the X-rays from G29.37+0.1 detected with Chandra between 2.5 and 7.5 keV (Obs-ID 11232 and 11801) (in cyan) with radio continuum emission at 610 MHz (in red). The locations of the two point sources detected in X rays are marked using plus symbols. The circle indicates the size and position for the TeV emission from HESS J1844−030. The inset depicts the X-ray emission after removing the point sources PS1 and PS2. The ellipse in the inset indicates the region used to extract the spectrum of the entire nebula (see Sect. 3.2.2). The dashed line marks the major-axis of the ellipse.
Current usage metrics show cumulative count of Article Views (full-text article views including HTML views, PDF and ePub downloads, according to the available data) and Abstracts Views on Vision4Press platform.
Data correspond to usage on the plateform after 2015. The current usage metrics is available 48-96 hours after online publication and is updated daily on week days.
Initial download of the metrics may take a while.