Fig. 4
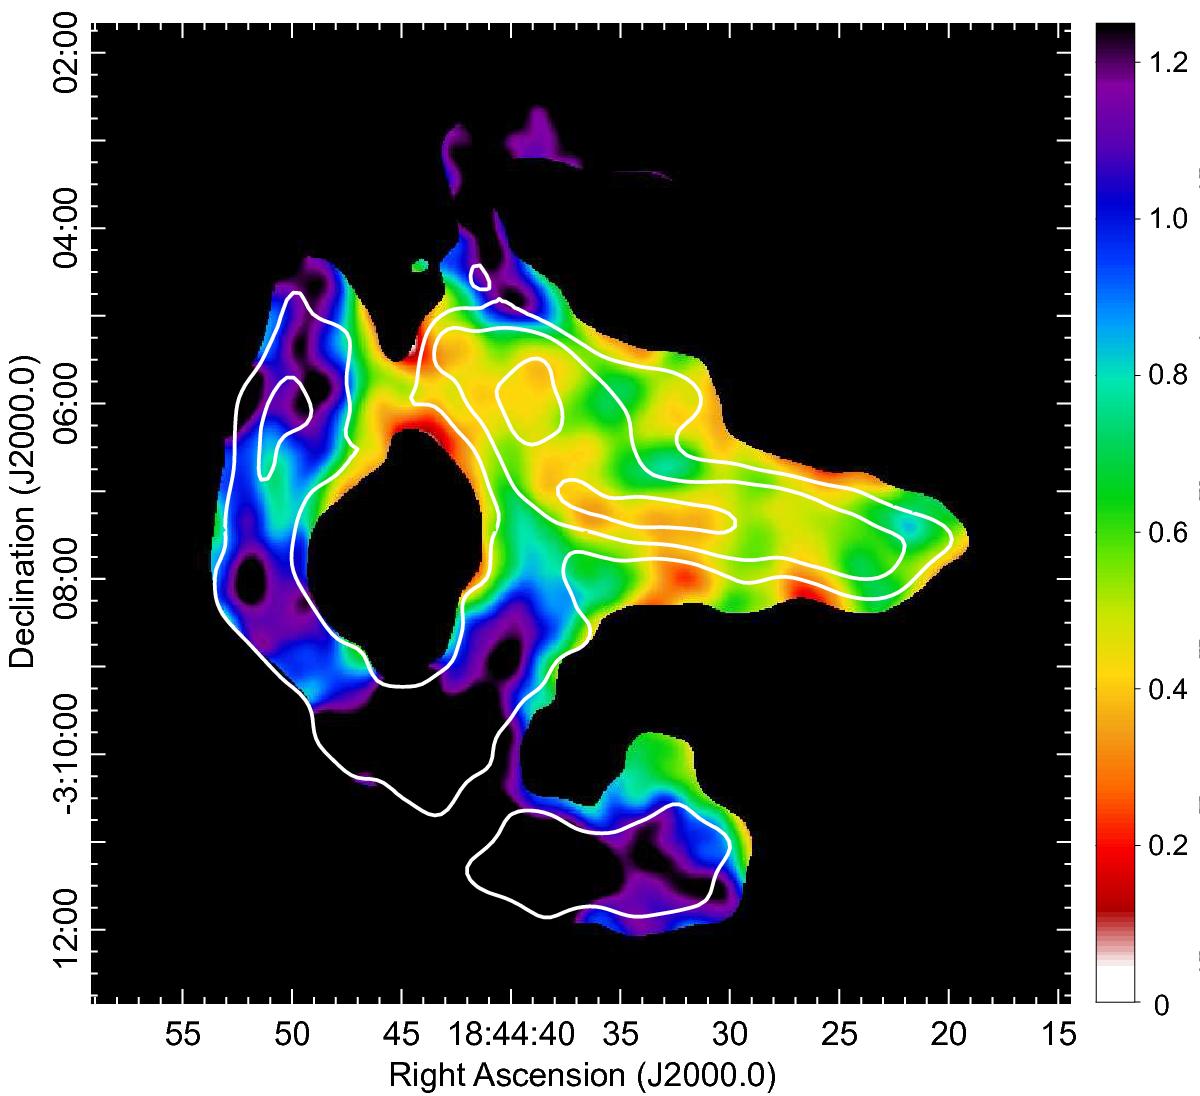
Spatial spectral index distribution in G29.37+0.1 in the interval of frequencies 610–1400 MHz performed using the new GMRT and the MAGPIS images (the spectral index follows the definition Sν ∝ ν− α). Only regions with flux densities greater than 4.3σ and 3σ of the respective noise levels at 610 and 1400 MHz were used to create the spectral index map. The 10, 20, and 40 mJy beam-1 contour levels from the 20′′ resolution 610 MHz image is included.
Current usage metrics show cumulative count of Article Views (full-text article views including HTML views, PDF and ePub downloads, according to the available data) and Abstracts Views on Vision4Press platform.
Data correspond to usage on the plateform after 2015. The current usage metrics is available 48-96 hours after online publication and is updated daily on week days.
Initial download of the metrics may take a while.