Fig. 3
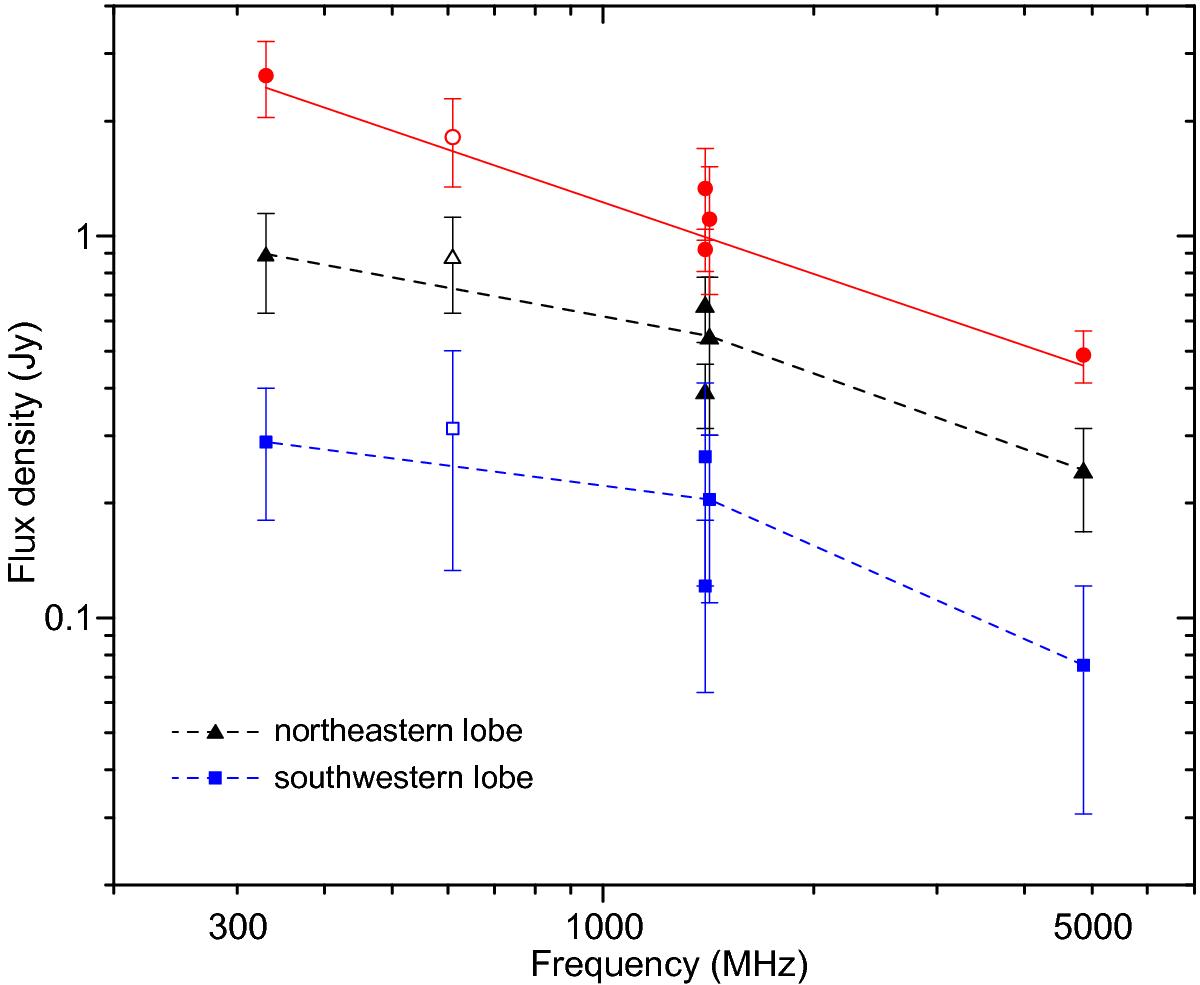
Total integrated spectrum for the S-shaped component and each radio lobe in G29.37+0.1. The flux density measurements made using the new GMRT image are indicated by an open symbol. The straight line represents a weighted fit with a power law index α = 0.59 ± 0.09 to the data points measured in the S-like feature. No fit was performed to the flux density estimates in both radio lobes (the dashed line between points is only a reference to the reader).
Current usage metrics show cumulative count of Article Views (full-text article views including HTML views, PDF and ePub downloads, according to the available data) and Abstracts Views on Vision4Press platform.
Data correspond to usage on the plateform after 2015. The current usage metrics is available 48-96 hours after online publication and is updated daily on week days.
Initial download of the metrics may take a while.