Fig. 12
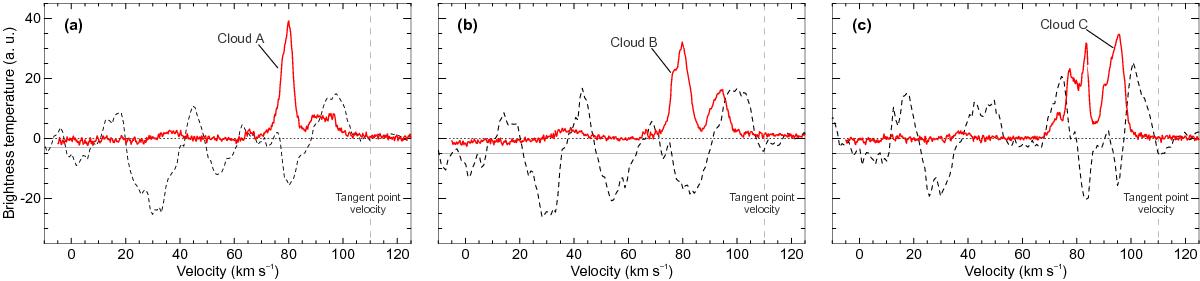
HI absorption spectra in comparison with the 13CO emission spectra toward the newly identified a) Cloud A; b) Cloud B; and c) Cloud C, which are coincident in projection with the halo emission in G29.37+0.1. In all cases the dashed line indicates the HI absorption spectrum obtained toward the bright clump of each cloud, while the 13CO emission spectrum is traced by the solid line. The vertical dashed line marks the velocity of the tangent point. The horizontal, solid line indicates the rms noise in the absorption spectra of the HI. The three cases show similar spectral features, which allow us to locate these three clouds at its near distance, dclouds ~ 5–6 kpc.
Current usage metrics show cumulative count of Article Views (full-text article views including HTML views, PDF and ePub downloads, according to the available data) and Abstracts Views on Vision4Press platform.
Data correspond to usage on the plateform after 2015. The current usage metrics is available 48-96 hours after online publication and is updated daily on week days.
Initial download of the metrics may take a while.