Fig. 11
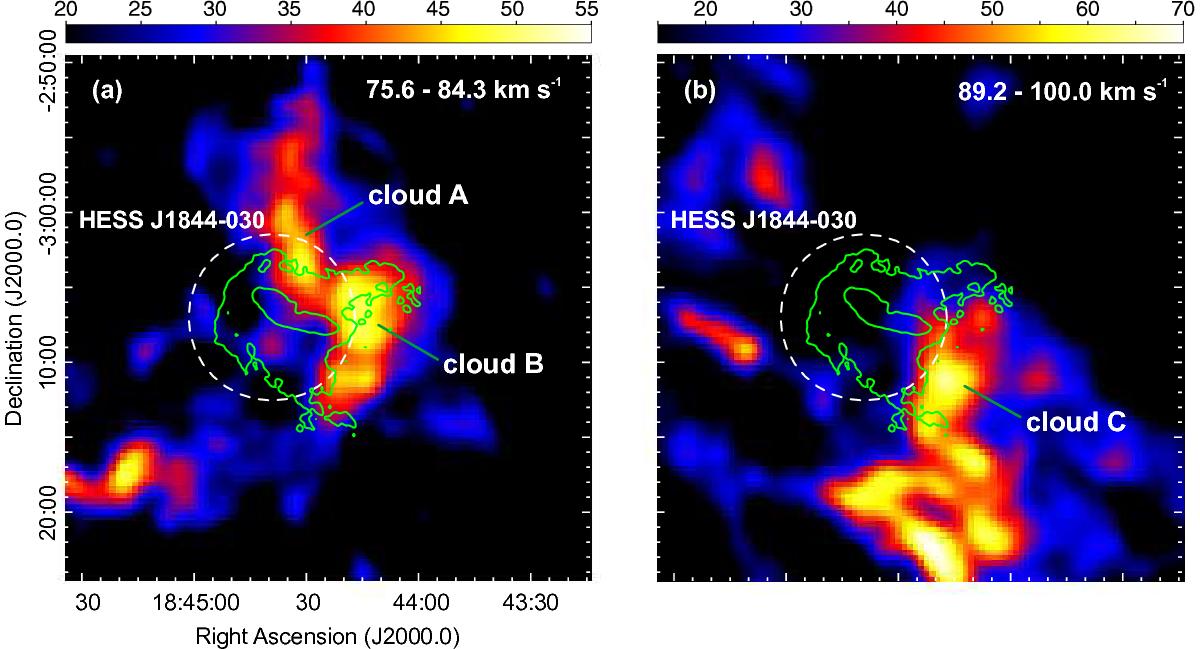
Emission of 13CO toward the G29.37+0.1 field, depicting the molecular clouds which show morphological agreement with the radio continuum emission from the halo component in G29.37+0.1 (green contours). Each image was obtained by integrating the 13CO emission in a velocity range suitable to reveal the structure of the molecular clouds. a) 13CO integration for clouds A and B, in the velocity range from 75.6 to 84.3 km s-1. b) cloud C, integrated between 89.2 and 100.0 km s-1. The white circle indicates the extension of HESS J1844−030 according to the last update on this source. The scale is linear, in K km s-1.
Current usage metrics show cumulative count of Article Views (full-text article views including HTML views, PDF and ePub downloads, according to the available data) and Abstracts Views on Vision4Press platform.
Data correspond to usage on the plateform after 2015. The current usage metrics is available 48-96 hours after online publication and is updated daily on week days.
Initial download of the metrics may take a while.