Fig. 7
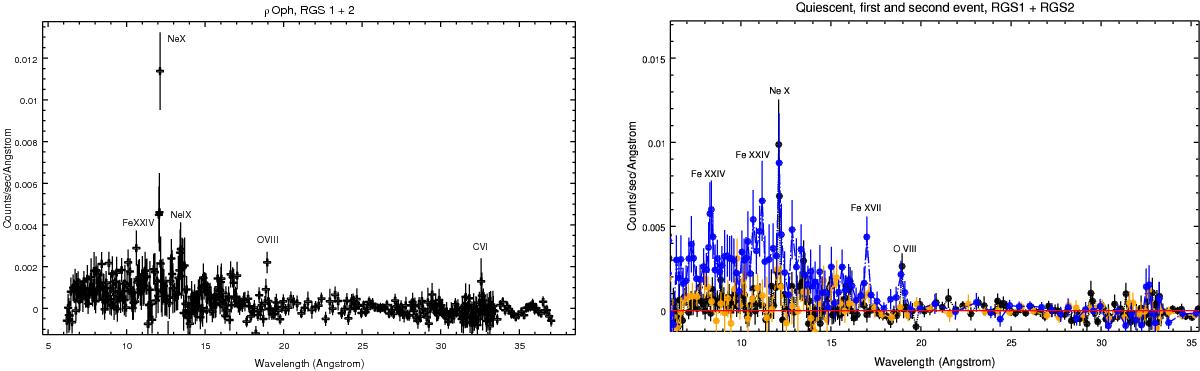
RGS spectra of ρ Oph A in the range 5–30 Å. Left panel: average spectrum during the full exposure (140 ks). The spectrum was binned to have at least 25 counts per bin. Right panel: black refers the spectrum relative to the quiescent state between the two main variability events, the orange spectrum refers to the first event, and the blue spectrum refers to the second event. Changes in the intensities of lines are visible mostly during the flare event at wavelengths below 12 Å, when both lines and continuum increased their strength.
Current usage metrics show cumulative count of Article Views (full-text article views including HTML views, PDF and ePub downloads, according to the available data) and Abstracts Views on Vision4Press platform.
Data correspond to usage on the plateform after 2015. The current usage metrics is available 48-96 hours after online publication and is updated daily on week days.
Initial download of the metrics may take a while.