Fig. 6
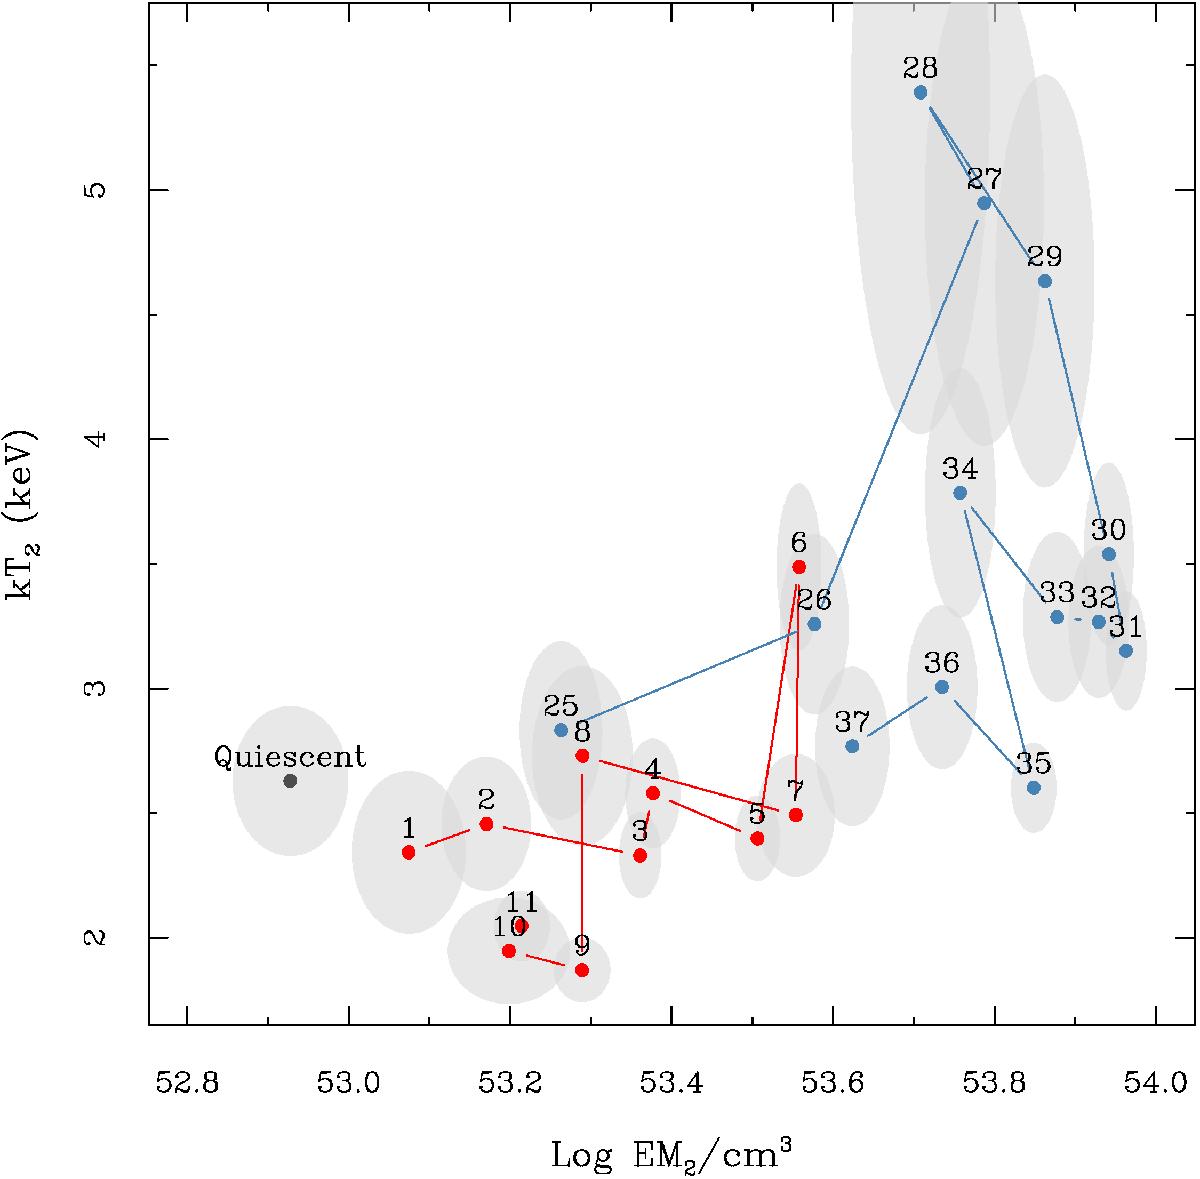
kT2 vs. emission measure (EM2) of the hot component of the 2T APEC best-fit models for the time intervals (see text) relative to the first event (red points) and second event (blue points). The point relative to the quiescent phase (time intervals 12–24) corresponds to the hottest component of the 3T VAPEC best-fit model. Ellipses denote the 1σ confidence ranges.
Current usage metrics show cumulative count of Article Views (full-text article views including HTML views, PDF and ePub downloads, according to the available data) and Abstracts Views on Vision4Press platform.
Data correspond to usage on the plateform after 2015. The current usage metrics is available 48-96 hours after online publication and is updated daily on week days.
Initial download of the metrics may take a while.