Fig. 4
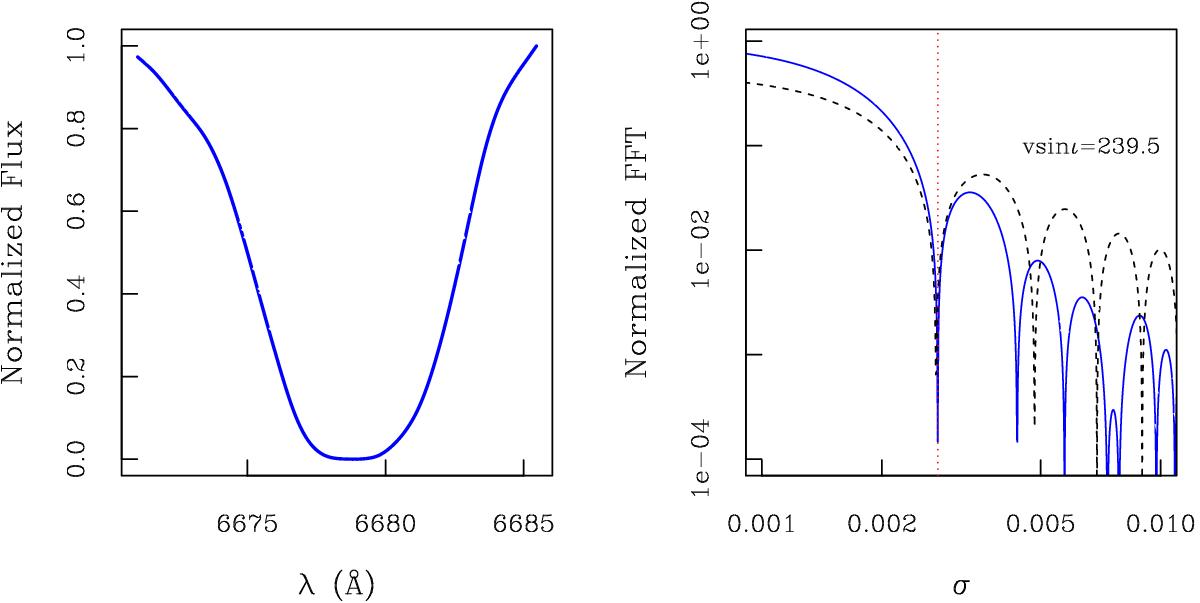
Smoothed normalized profile of He line at 6678 Å (left) and normalized amplitude of Fourier transform of the same profile (right, solid line). The dotted curve denotes the transform of the rotational broadening profile alone. The first minimum occurs at σ ~ 0.00275 c/Å (vertical dotted line), corresponding to vsini ~ 239.5 km s-1. Uncertainty on vsini is estimated at around ±10 km s-1.
Current usage metrics show cumulative count of Article Views (full-text article views including HTML views, PDF and ePub downloads, according to the available data) and Abstracts Views on Vision4Press platform.
Data correspond to usage on the plateform after 2015. The current usage metrics is available 48-96 hours after online publication and is updated daily on week days.
Initial download of the metrics may take a while.