Fig. 9
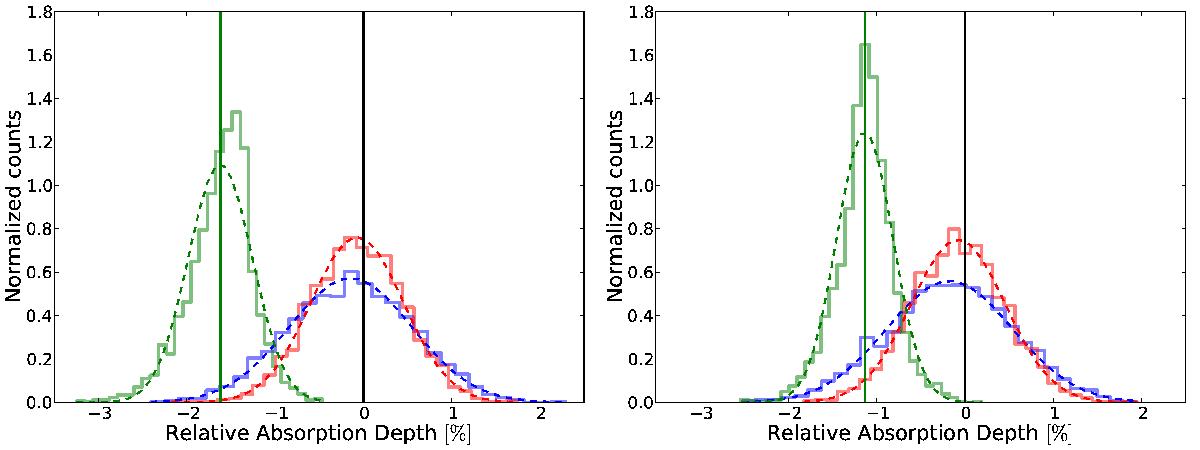
Distribution obtained with the empirical Monte Carlo analysis for the Na i D2 line (left) and D1 line (right). In-in, out-out, and in-out distribution (continuous lines) are shown in blue, red, and green with their respective Gaussian fit (dotted lines). The green vertical lines are the averages values of the in-out distribution.
Current usage metrics show cumulative count of Article Views (full-text article views including HTML views, PDF and ePub downloads, according to the available data) and Abstracts Views on Vision4Press platform.
Data correspond to usage on the plateform after 2015. The current usage metrics is available 48-96 hours after online publication and is updated daily on week days.
Initial download of the metrics may take a while.