Fig. 3
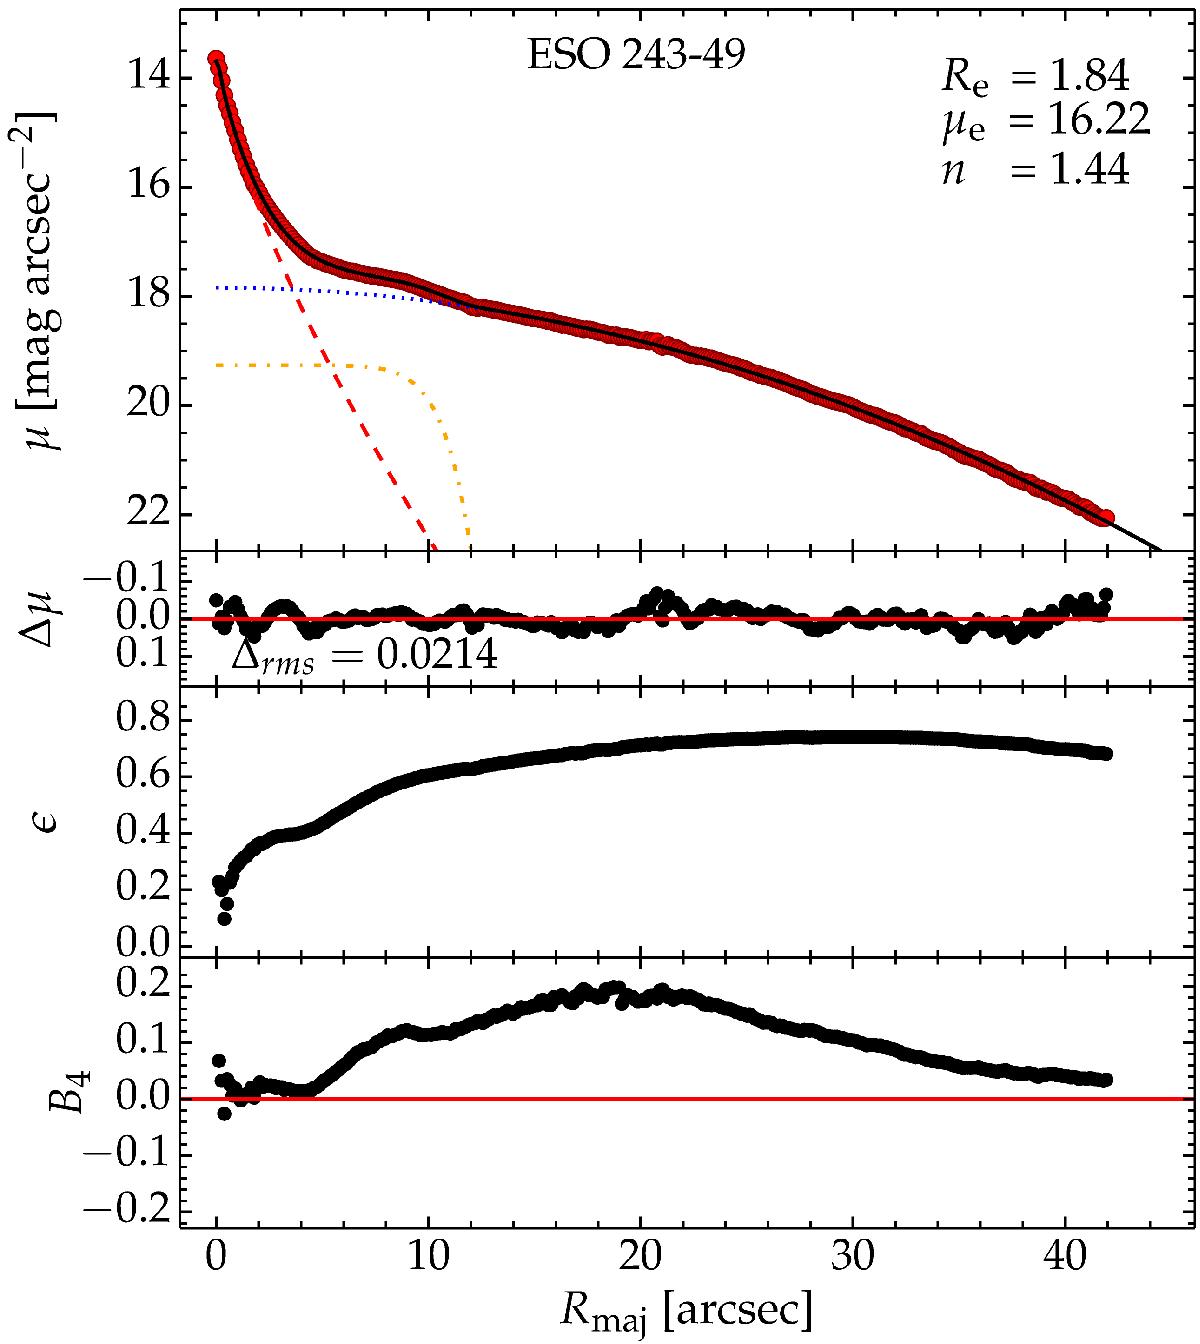
H-band major-axis surface brightness profile of ESO 243-49. The red circles are the data extracted from the HST image, while the black curve represents the best-fitting model, which in turn is built up of a spheroid or bulge (red dashed line), a bar (yellow dot-dashed line) and an edge-on disc (blue dotted line). The inset numbers are the Sérsic parameters of the bulge. The residual profile is shown in the next panel below, followed by the ellipticity and B4 amplitude (discyness) profiles.
Current usage metrics show cumulative count of Article Views (full-text article views including HTML views, PDF and ePub downloads, according to the available data) and Abstracts Views on Vision4Press platform.
Data correspond to usage on the plateform after 2015. The current usage metrics is available 48-96 hours after online publication and is updated daily on week days.
Initial download of the metrics may take a while.