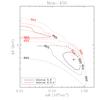
Fig. 4

Optical and X-ray variability of Mon-456. The upper left panel shows part of the CoRoT light curve. The Chandra frames are the unshaded intervals (the shaded intervals are those not observed with Chandra). The dotted vertical lines delimit the time intervals we defined; the black dots mark the observed X-ray photon fluxes in the broad-band (circled if, during the given time interval, the source flared in X-rays). The numbers above the light curve indicate the Chandra Obs.ID of the given Chandra frame (top number), the number of detected X-ray photons (middle number), and the label (bottom number) of the given time interval. The upper right panels show the variability of selected X-ray properties (in this case, the hydrogen column density NH in units of 1022cm-2; and the plasma temperature kT, in keV) versus the median CoRoT fluxes observed in the time intervals indicated by the labels. Empty circles mark intervals with unacceptable X-ray spectral fit. The bottom panel shows contour levels in the C-stat space enclosing solutions within 68% (solid contour), 90% (dashed contour), and 99% (dotted contour) statistical confidence from the X-ray spectral fit of Mon-456 during the intervals #2+#3+#4 (red contours) and #5+#6 (black contours). The crosses indicate the values obtained from the best fit in the latter case.
Current usage metrics show cumulative count of Article Views (full-text article views including HTML views, PDF and ePub downloads, according to the available data) and Abstracts Views on Vision4Press platform.
Data correspond to usage on the plateform after 2015. The current usage metrics is available 48-96 hours after online publication and is updated daily on week days.
Initial download of the metrics may take a while.


