Fig. 23
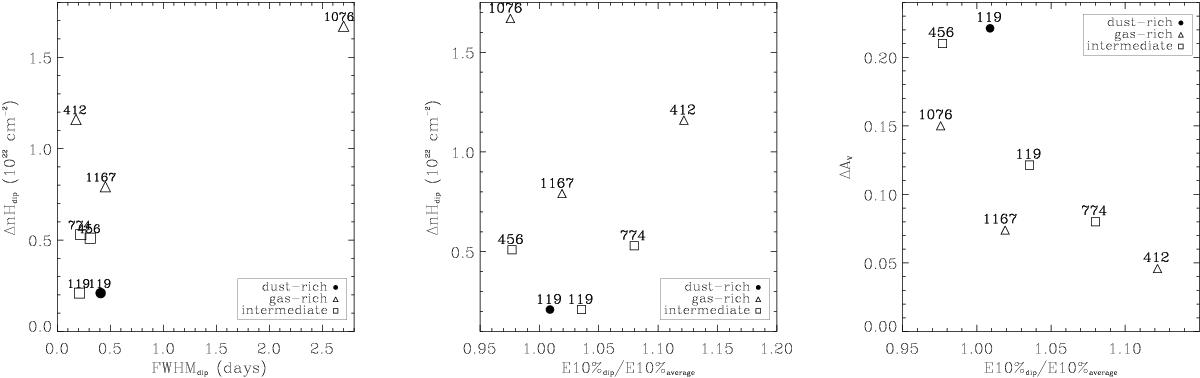
Optical and X-ray properties of the dips where we observe an increasing X-ray absorption, described in Table 6. The left panel shows NH versus FWHM of the dips, the central panel shows ΔNH due to the dips versus the ratio between the 10% photon energy quantile E10% observed during the dip and that in the average X-ray spectrum, and the right panel shows ΔAV increment observed during the dip versus the E10% dip/E10% average ratio. In all three panels, different symbols are used to mark dips with different NH/AV ratio and the labels show the stellar Mon-IDs.
Current usage metrics show cumulative count of Article Views (full-text article views including HTML views, PDF and ePub downloads, according to the available data) and Abstracts Views on Vision4Press platform.
Data correspond to usage on the plateform after 2015. The current usage metrics is available 48-96 hours after online publication and is updated daily on week days.
Initial download of the metrics may take a while.