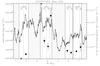
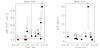
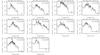
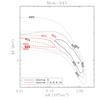
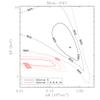
Fig. 18

Time variability of the optical flux and X-ray properties of Mon-945 with panel layout and content as in Fig. 4. Contour levels in the C-stat space corresponding to the 68%, 90%, and 99% statistical confidence regions from the fit of the X-ray spectrum of Mon-945 observed during the intervals #3 (bottom left panel, black contours) and #5 (bottom right panel, black contours) are also shown. In both bottom panels the red contours are obtained from the average spectrum observed in #1+#2+#8+#9+#10. The cross marks the values obtained from the best fit.
Current usage metrics show cumulative count of Article Views (full-text article views including HTML views, PDF and ePub downloads, according to the available data) and Abstracts Views on Vision4Press platform.
Data correspond to usage on the plateform after 2015. The current usage metrics is available 48-96 hours after online publication and is updated daily on week days.
Initial download of the metrics may take a while.