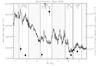
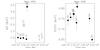
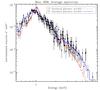
Fig. 13

Optical and X-ray variability of Mon-808, with panel format and content generally following Fig. 4. There are two differences with respect to prior figures: i) the upper right panels show the variability of kT and E10% in units of keV; and ii) the dots in the upper left panel show the X-ray photon flux in the 0.5–0.8 keV energy band. The central panels show the X-ray spectra observed in the time intervals (dots) with the best fit 1T thermal plasma model (black line), together with the 2T model (red line) when needed. The bottom left panel shows the normalization of the soft component obtained by fitting the X-ray spectrum observed in the time intervals with the 2T thermal plasma model, with plasma temperatures fixed at kTsoft = 0.3 keV and kThard = 1.6 keV and NH fixed at the value obtained from the optical extinction (0.009 × 1022 cm-2). The bottom right panel shows the average X-ray spectrum (dots). The dashed red line shows the best fit 1T thermal plasma model, while the blue line is the 2T model.
Current usage metrics show cumulative count of Article Views (full-text article views including HTML views, PDF and ePub downloads, according to the available data) and Abstracts Views on Vision4Press platform.
Data correspond to usage on the plateform after 2015. The current usage metrics is available 48-96 hours after online publication and is updated daily on week days.
Initial download of the metrics may take a while.