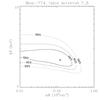
Fig. 11
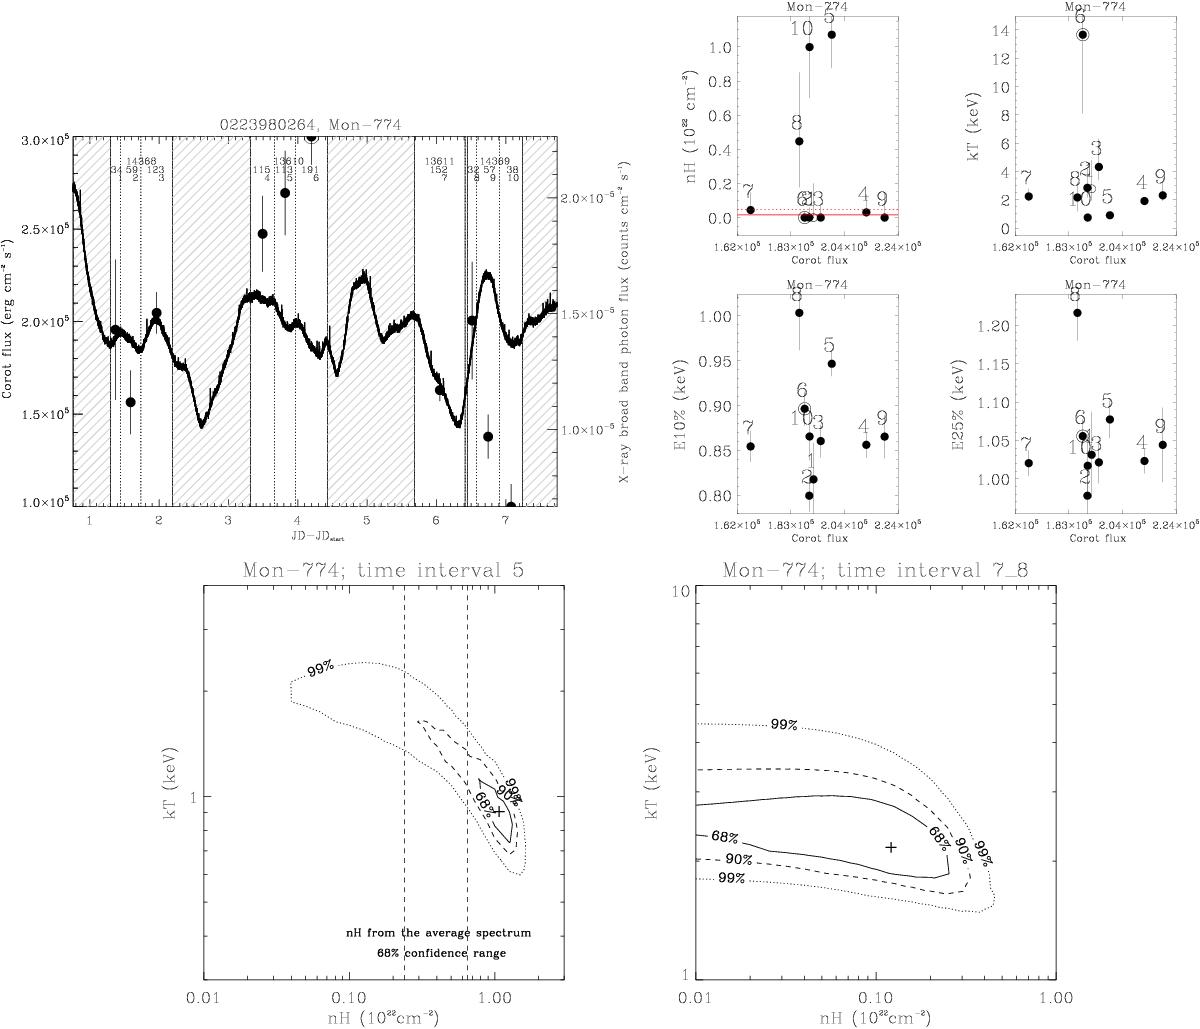
Optical and X-ray variability of Mon-774, with panel format and content generally following Fig. 4. The contours are from the X-ray spectral fit of the spectrum observed during the interval #5 (left bottom panel) and #7+#8 (right bottom panel). The vertical dashed lines in the top panel mark the 68% confidence range for the NH obtained fitting the average spectrum.
Current usage metrics show cumulative count of Article Views (full-text article views including HTML views, PDF and ePub downloads, according to the available data) and Abstracts Views on Vision4Press platform.
Data correspond to usage on the plateform after 2015. The current usage metrics is available 48-96 hours after online publication and is updated daily on week days.
Initial download of the metrics may take a while.