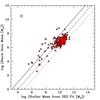
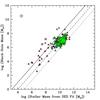
Fig. 7
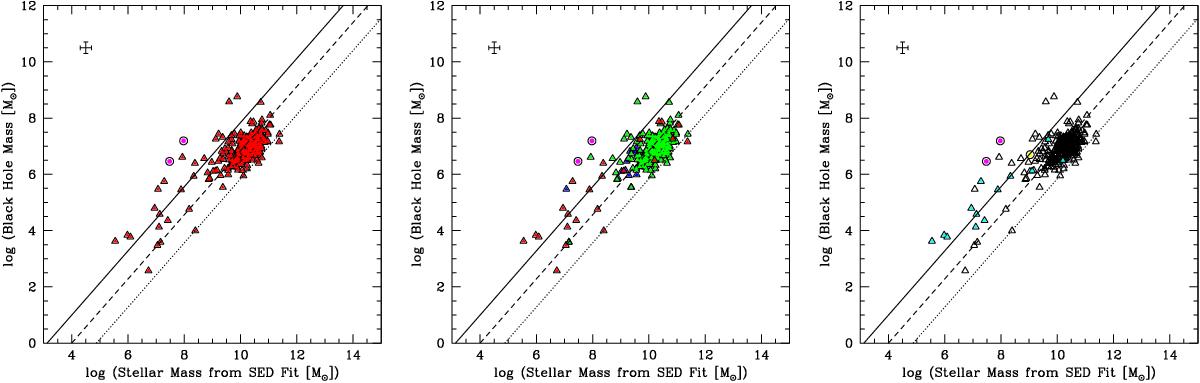
Left: total stellar mass from SED fit vs. black hole mass obtained using the bolometric luminosity for our infrared sample of 264 galaxies with both known redshifts/distances and stellar masses (red filled triangles). The data points and bisector linear regression fit of Marleau et al. (2013) (dashed line) are plotted for Lbol/LEdd = 0.1. Also shown are the fit for Lbol/LEdd = 1.0 (dotted line) and for Lbol/LEdd = 0.01 (solid line). Middle: same as left, but showing previously identified AGN of type 1 and type-2, respectively shown as green filled triangles and blue filled triangles, and the AGN candidates identified from the IR diagnostic only, shown as red filled triangles. Also shown are the two low-metallicity and heavily obscured BCDs that were originally identified by Griffith et al. (2011) (magenta filled circles). Right: same as left, but showing the BCDs (cyan filled triangles), the two low-metallicity and heavily obscured BCDs that were originally identified by Griffith et al. (2011) (magenta filled circles), and the BCD MRK 709 S with X-ray and radio emission indicative of AGN activity (yellow filled circle).
Current usage metrics show cumulative count of Article Views (full-text article views including HTML views, PDF and ePub downloads, according to the available data) and Abstracts Views on Vision4Press platform.
Data correspond to usage on the plateform after 2015. The current usage metrics is available 48-96 hours after online publication and is updated daily on week days.
Initial download of the metrics may take a while.