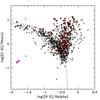
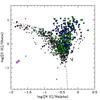
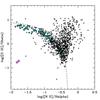
Fig. 3

Left: [OIII]/Hβ vs. [NII]/Hα diagnostic diagram for the 954 out of the 3326 galaxies with both line flux ratio measurements from the MPA/JHU catalogue. As in Fig. 1, the 135 sources above our IR colour cut are shown as red filled triangles. The dashed line is the demarcation line between normal star-forming galaxies and AGN from Stasinska et al. (2006). Middle: same as left, but showing the 126 AGN that were previously identified in the MRBGD optical samples split into 111 type 1 (BL; green filled triangles) and 16 type 2 (NL; blue filled triangles). One-third of this MRBGD sample are located in the region for HII galaxies. The 9 candidate AGN, selected using the IR diagnostic, which are not in the samples of MRBGD are shown as red filled triangles. Right: same as left, but showing the 83 BCDs (cyan filled triangles) and the two low-metallicity and heavily obscured BCDs that were originally identified by Griffith et al. (2011) (magenta filled circles). The BCD MRK 709 S (yellow filled circle), one of the most metal-poor BCDs with X-ray and radio emission indicative of AGN activity, is also located in the region for HII galaxies.
Current usage metrics show cumulative count of Article Views (full-text article views including HTML views, PDF and ePub downloads, according to the available data) and Abstracts Views on Vision4Press platform.
Data correspond to usage on the plateform after 2015. The current usage metrics is available 48-96 hours after online publication and is updated daily on week days.
Initial download of the metrics may take a while.


