Fig. 2
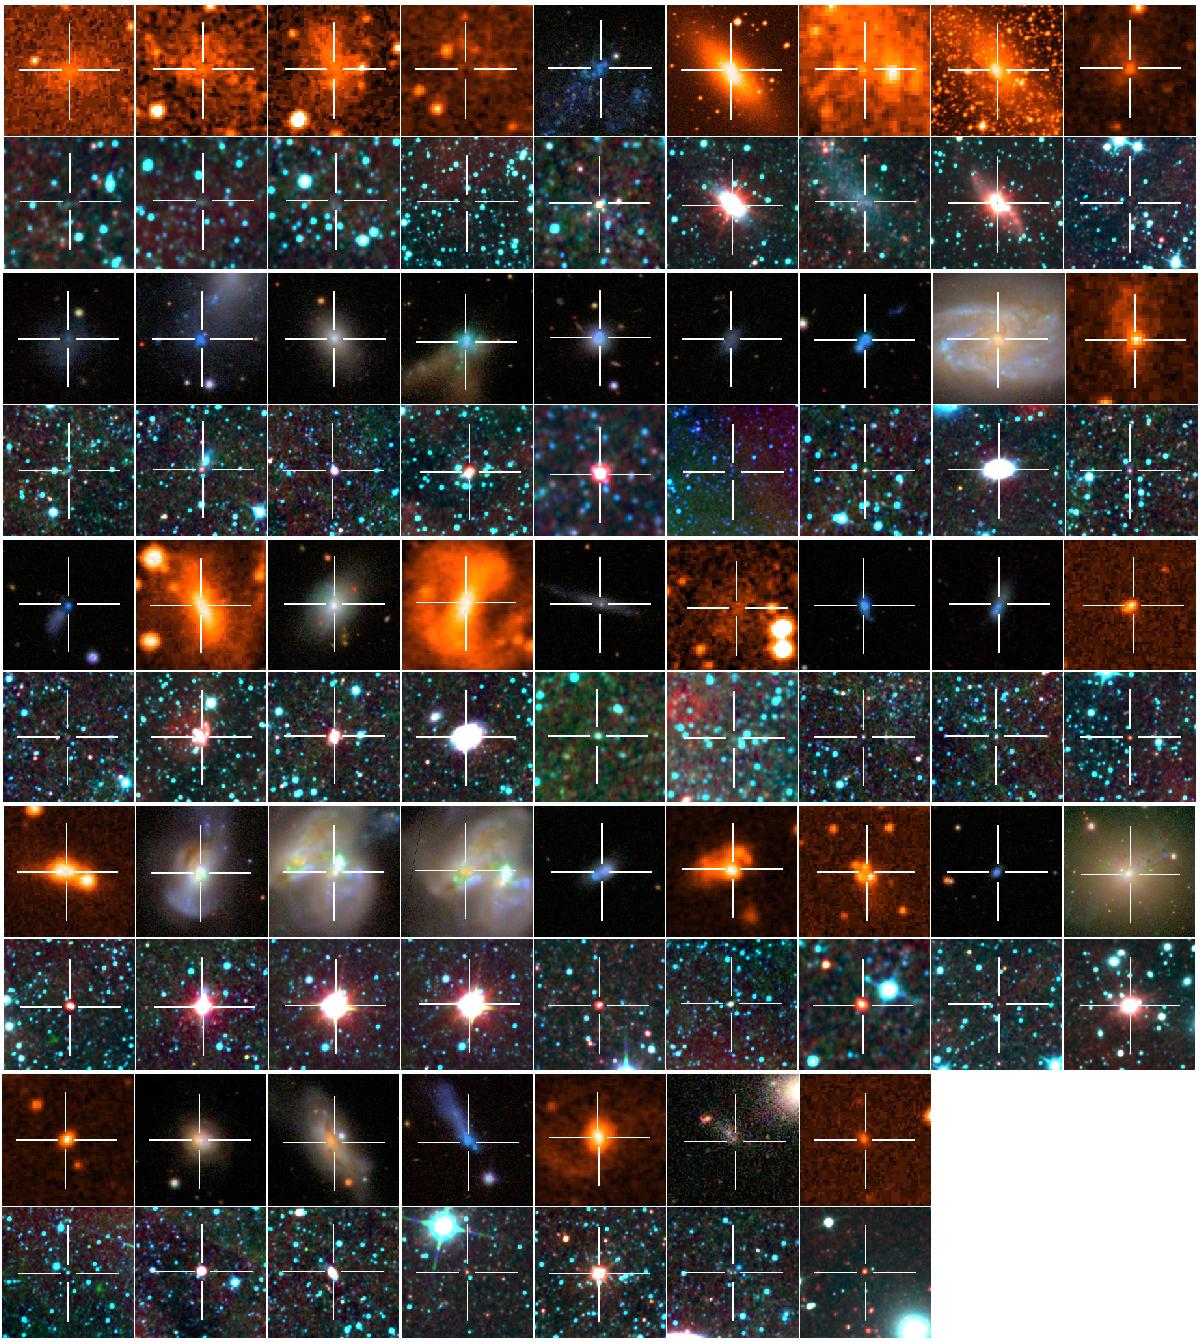
Mosaic of the 43 candidate AGN, selected using the IR diagnostic, which are not in the samples of MRBGD. They are ordered, from left to right and top to bottom, by increasing distance with the exception of the first three candidates, which have no known redshift/distance (see Table 2). The top images are either optical g′, r′, i′ colour images from SDSS, which are 76.8′′ on a side (except for OBJ 36, which is 153′′ on a side), or false colour images from the DSS-2-red catalogue, which are 1′ on a side (except for OBJ 6 and 8, which are 4′ on a side). The bottom images are W1, W2, W3 colour images from WISE, ~9′ on a side (except for OBJ 14, 23 and 34, which are ~4′ on a side).
Current usage metrics show cumulative count of Article Views (full-text article views including HTML views, PDF and ePub downloads, according to the available data) and Abstracts Views on Vision4Press platform.
Data correspond to usage on the plateform after 2015. The current usage metrics is available 48-96 hours after online publication and is updated daily on week days.
Initial download of the metrics may take a while.