Fig. 5
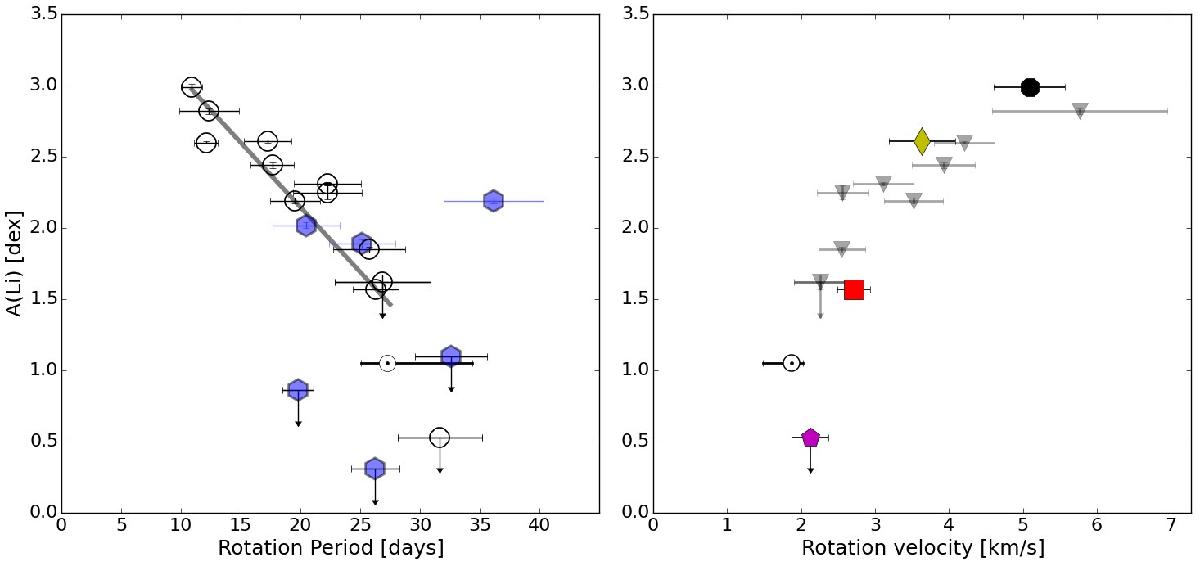
Lithium abundance versus rotation for the 18 seismic solar analogues. The left and right panels compare A(Li) with the surface rotation period from space photometry and the computed surface rotation velocity, respectively. Stars found to be located in binaries are shown as filled blue octagons in the left-hand panel, and they are removed from the right panel. In both panels, the full range covered by the differential solar rotation is represented by the horizontal error bar in the solar symbol. The solid line in the left panel depicts the best-fitting relation for single stars between the rotation period and A(Li) for stars with rotation periods shorter than the solar value. In the right panel, the source of the asteroseismic radius is illustrated through the choice of symbols. Triangle markers indicate stars whose radius has been determined through global parameter modelling. Upper limits of the measured A(Li) are shown for stars with low lithium abundance or insufficient S/N in the spectra. The single stars with the radius from detailed modelling from amp, KIC 10644253, KIC 6116048, KIC 7680114, and KIC 3656476, are plotted as black octagon, yellow diamond, red square, and magenta pentagon, respectively.
Current usage metrics show cumulative count of Article Views (full-text article views including HTML views, PDF and ePub downloads, according to the available data) and Abstracts Views on Vision4Press platform.
Data correspond to usage on the plateform after 2015. The current usage metrics is available 48-96 hours after online publication and is updated daily on week days.
Initial download of the metrics may take a while.