Fig. 4
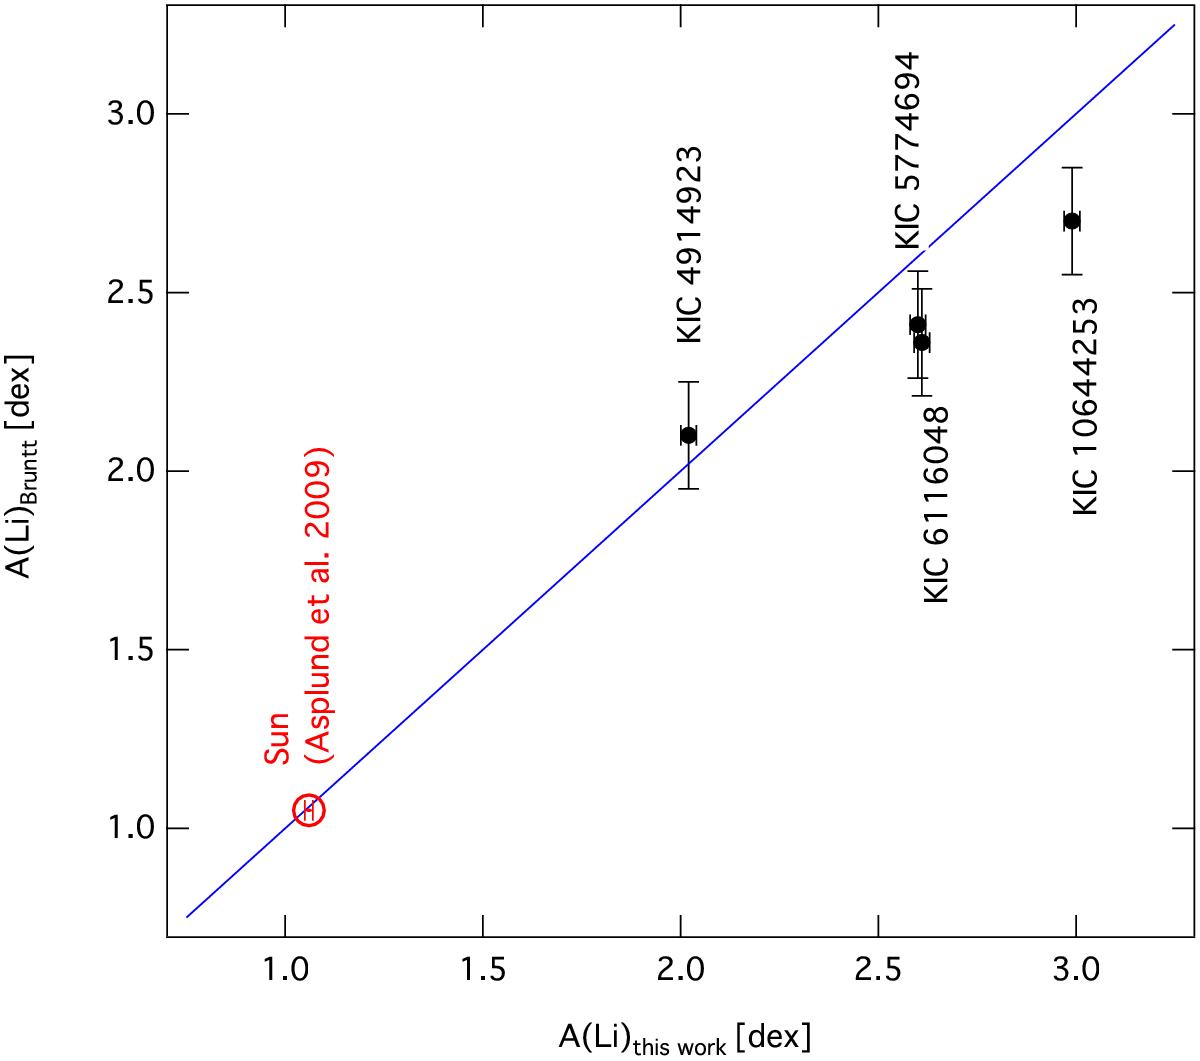
Comparison of the measured lithium abundances with values from the literature (see Table 4). Black squares show the four stars from our sample that overlap with the stars of Bruntt et al. (2012). The red circle depicts the comparison of the solar lithium abundance derived from our spectrum with the canonical value by Asplund et al. (2009). The blue line denotes the 1:1 ratio between the two data sets.
Current usage metrics show cumulative count of Article Views (full-text article views including HTML views, PDF and ePub downloads, according to the available data) and Abstracts Views on Vision4Press platform.
Data correspond to usage on the plateform after 2015. The current usage metrics is available 48-96 hours after online publication and is updated daily on week days.
Initial download of the metrics may take a while.