Fig. A.1
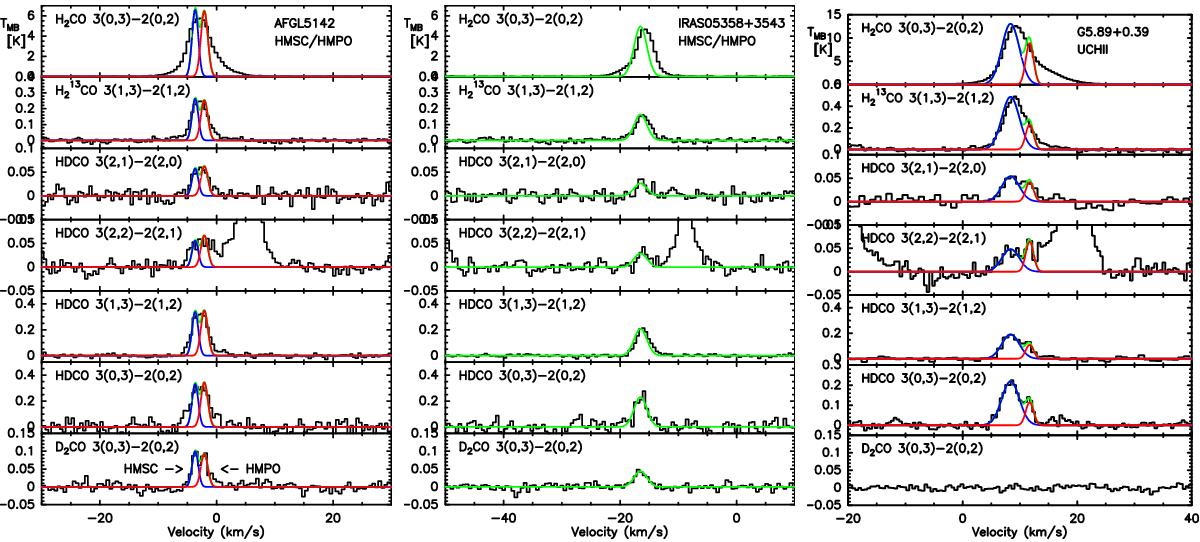
From left to right: spectra of H2CO 30,3−20,2, H![]() CO 31,3−21,2, HDCO 32,1−22,0, 32,2−22,1, 31,3−21,2, 30,3−20,2 and D2CO 30,3−20,2 observed toward AFGL5142, IRAS 05358+3543, and G5.89-0.39 using the IRAM 30 m telescope (Fontani et al. 2011, 2015) and the APEX SEPIA Band 5 receiver (this work). Red and blue lines indicate the fitted different velocity components for AFGL5142 and G5.89-0.39 with fixed velocity and width. The C13CS N = 15−14 and J = 15−14 transition is shown in the fourth panels from the top.
CO 31,3−21,2, HDCO 32,1−22,0, 32,2−22,1, 31,3−21,2, 30,3−20,2 and D2CO 30,3−20,2 observed toward AFGL5142, IRAS 05358+3543, and G5.89-0.39 using the IRAM 30 m telescope (Fontani et al. 2011, 2015) and the APEX SEPIA Band 5 receiver (this work). Red and blue lines indicate the fitted different velocity components for AFGL5142 and G5.89-0.39 with fixed velocity and width. The C13CS N = 15−14 and J = 15−14 transition is shown in the fourth panels from the top.
Current usage metrics show cumulative count of Article Views (full-text article views including HTML views, PDF and ePub downloads, according to the available data) and Abstracts Views on Vision4Press platform.
Data correspond to usage on the plateform after 2015. The current usage metrics is available 48-96 hours after online publication and is updated daily on week days.
Initial download of the metrics may take a while.