Fig. 2
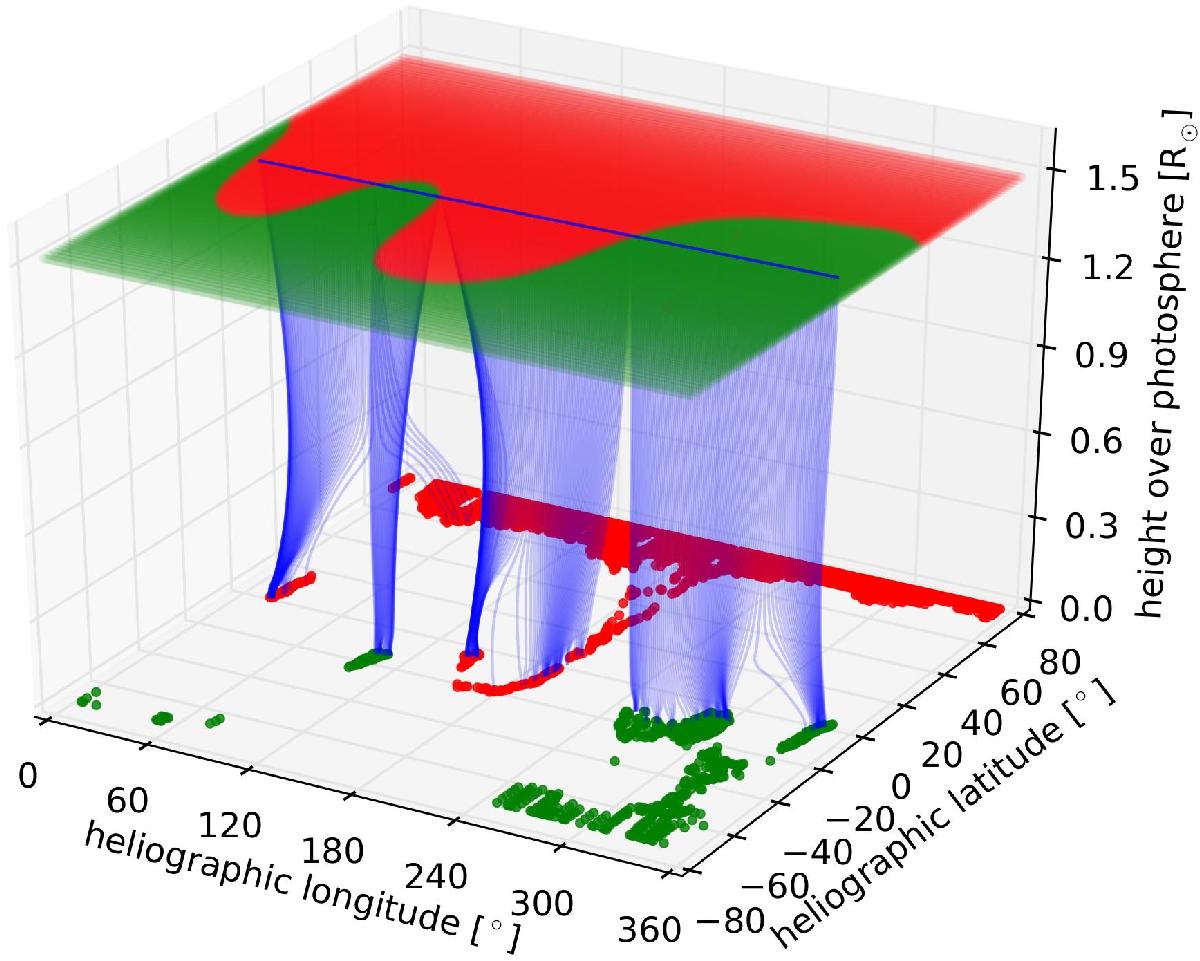
Magnetic field map to illustrate the PFSS mapping. The intersection points with the source surface and foot points of the open magnetic field lines of the PFSS model are shown in red and green, where the colors depict the inward and outward polarities. The determined source-field lines and their course through the corona are shown in blue. The PFSS map corresponds to CR 2050, the underlying magnetogram is based on MDI observations.
Current usage metrics show cumulative count of Article Views (full-text article views including HTML views, PDF and ePub downloads, according to the available data) and Abstracts Views on Vision4Press platform.
Data correspond to usage on the plateform after 2015. The current usage metrics is available 48-96 hours after online publication and is updated daily on week days.
Initial download of the metrics may take a while.