Fig. 13
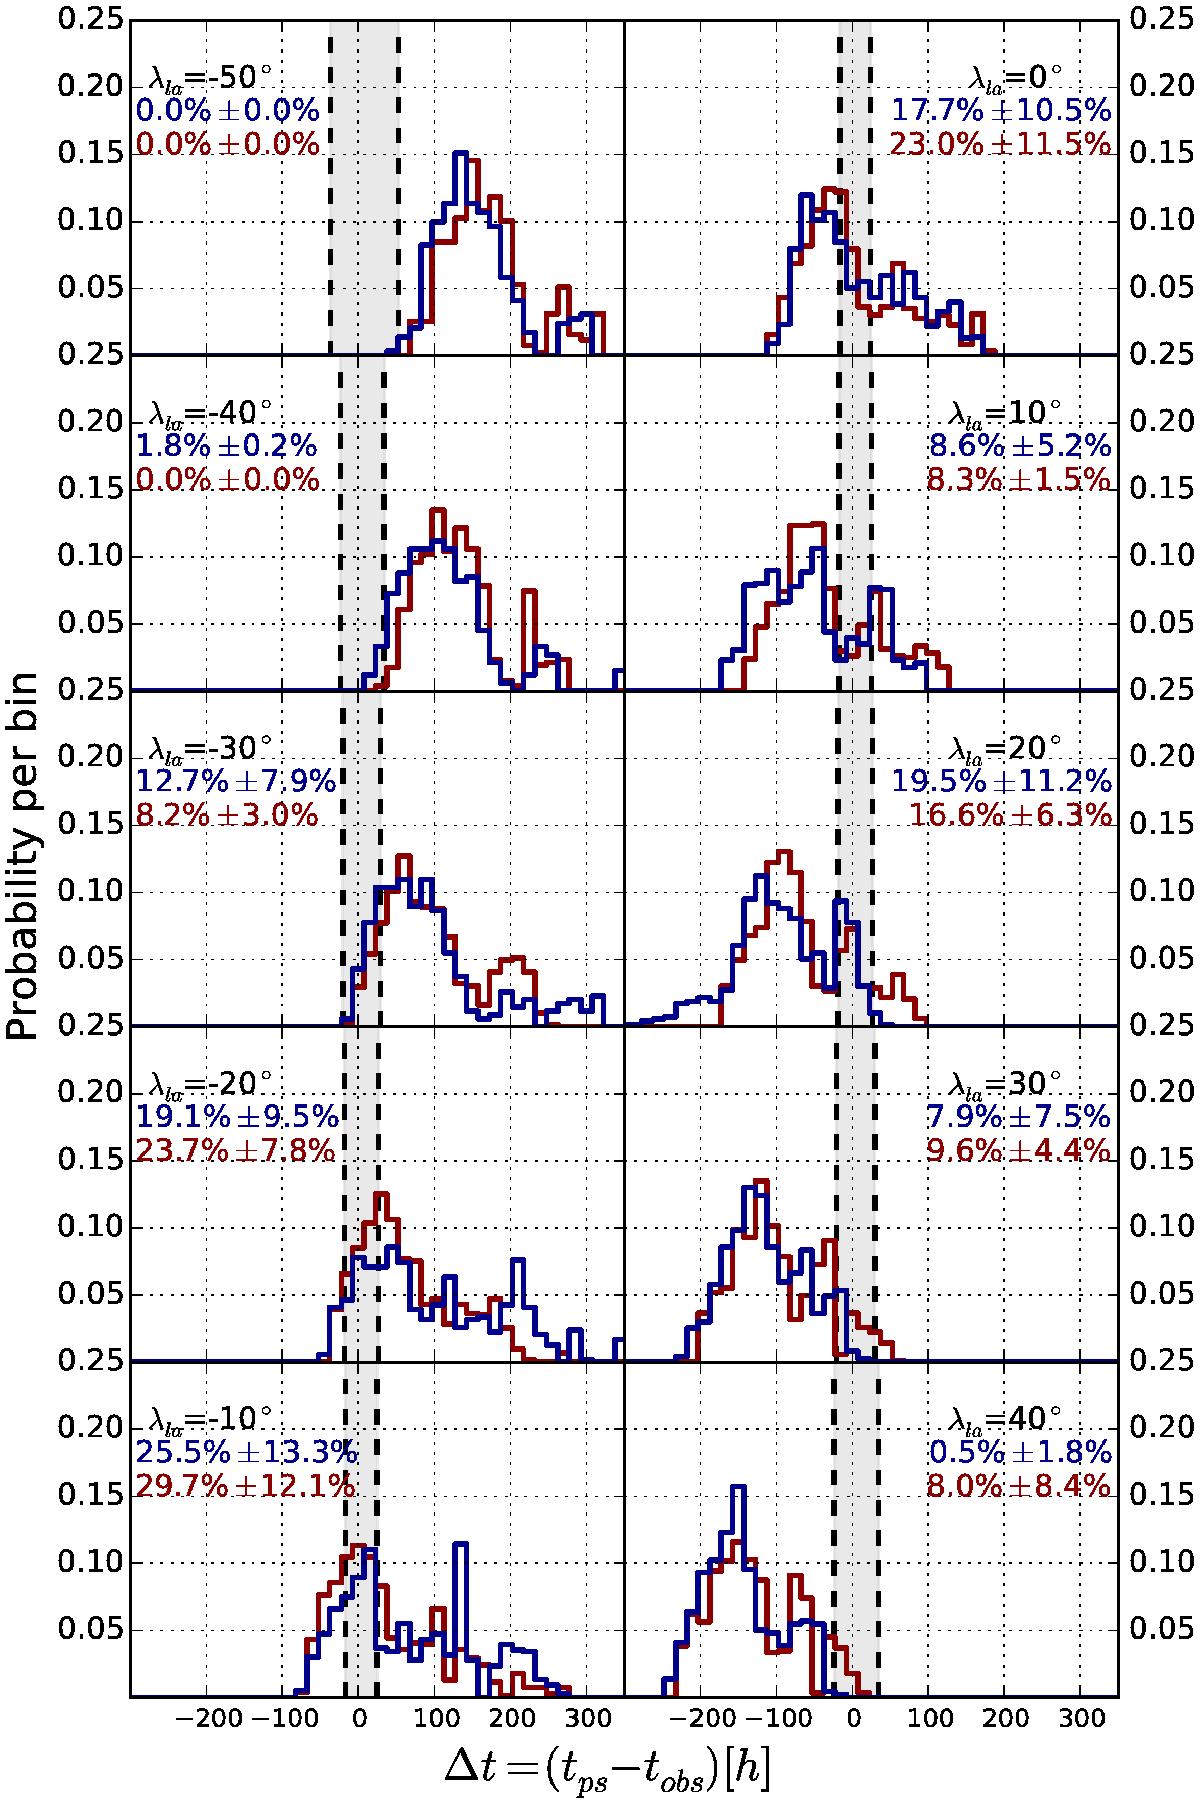
Comparison of the leading stripe mapping between the PFSS (red histograms) and the CSSS (blue histograms) model. The axes are the same as in Fig. 12. Note that the subset of CRs used for this comparison only includes four rotations. The solar wind speed window covers the range from 0 to 350 km s-1. The errors given are the statistical errors originating from the variation between the CRs.
Current usage metrics show cumulative count of Article Views (full-text article views including HTML views, PDF and ePub downloads, according to the available data) and Abstracts Views on Vision4Press platform.
Data correspond to usage on the plateform after 2015. The current usage metrics is available 48-96 hours after online publication and is updated daily on week days.
Initial download of the metrics may take a while.