Fig. 11
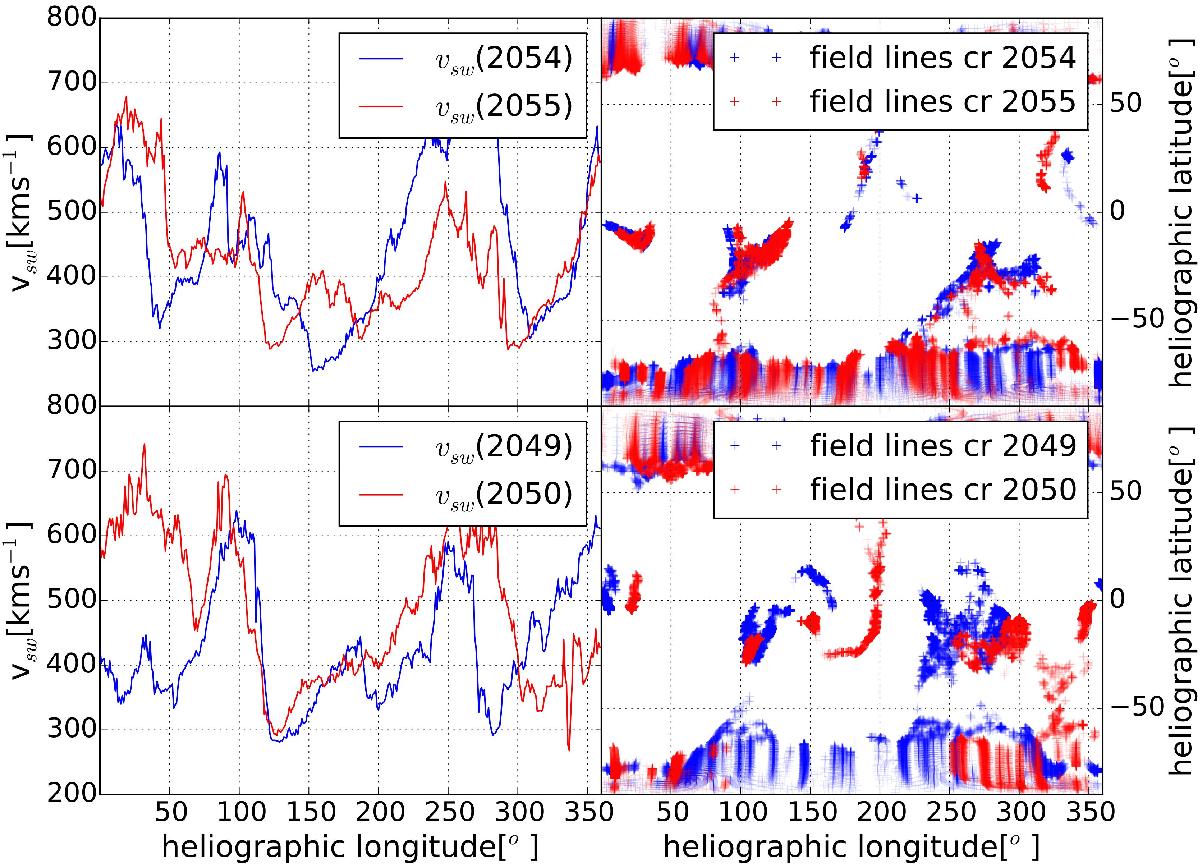
Comparison between consecutive CRs. The left panels show the solar wind velocity taken from ACE for the respective CRs while the right panels show the PFSS model data of the photospheric foot points of the open magnetic field line. The latter rotations 2055 and 2050 are shown in red, the former rotations 2054 and 2049 are shown in blue. The upper panels show the case for CR 2055, where the predictions produced very good results while the lower panel show the case for rotation 2050, where only very poor results were produced.
Current usage metrics show cumulative count of Article Views (full-text article views including HTML views, PDF and ePub downloads, according to the available data) and Abstracts Views on Vision4Press platform.
Data correspond to usage on the plateform after 2015. The current usage metrics is available 48-96 hours after online publication and is updated daily on week days.
Initial download of the metrics may take a while.