Fig. 10
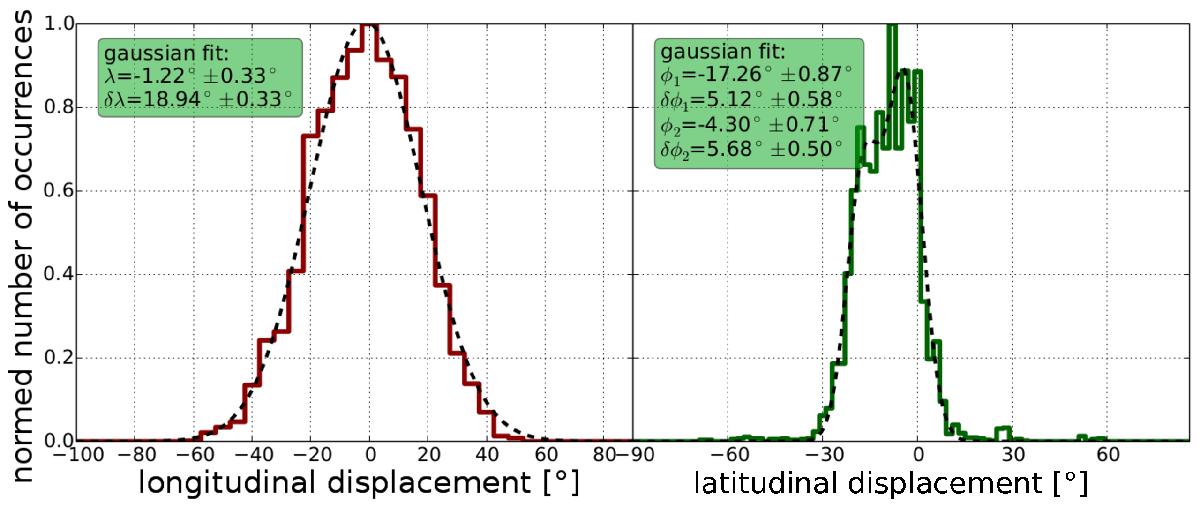
PFSS induced longitudinal (left) and latitudinal (right) displacement between source surface position and photospheric position similar to Fig. 4. The y axis gives the normed number of occurrences for both plots. The calculation was made for Solar Orbiter’s orbit over the course of 19 consecutive CRs, each plot also shows a fit with a simple Gaussian (left) or rather a sum of two Gaussian (right). We note the stronger shift to lower latitudes compared to Fig. 4 due to Solar Orbiter’s tilted orbit.
Current usage metrics show cumulative count of Article Views (full-text article views including HTML views, PDF and ePub downloads, according to the available data) and Abstracts Views on Vision4Press platform.
Data correspond to usage on the plateform after 2015. The current usage metrics is available 48-96 hours after online publication and is updated daily on week days.
Initial download of the metrics may take a while.