Fig. A.3
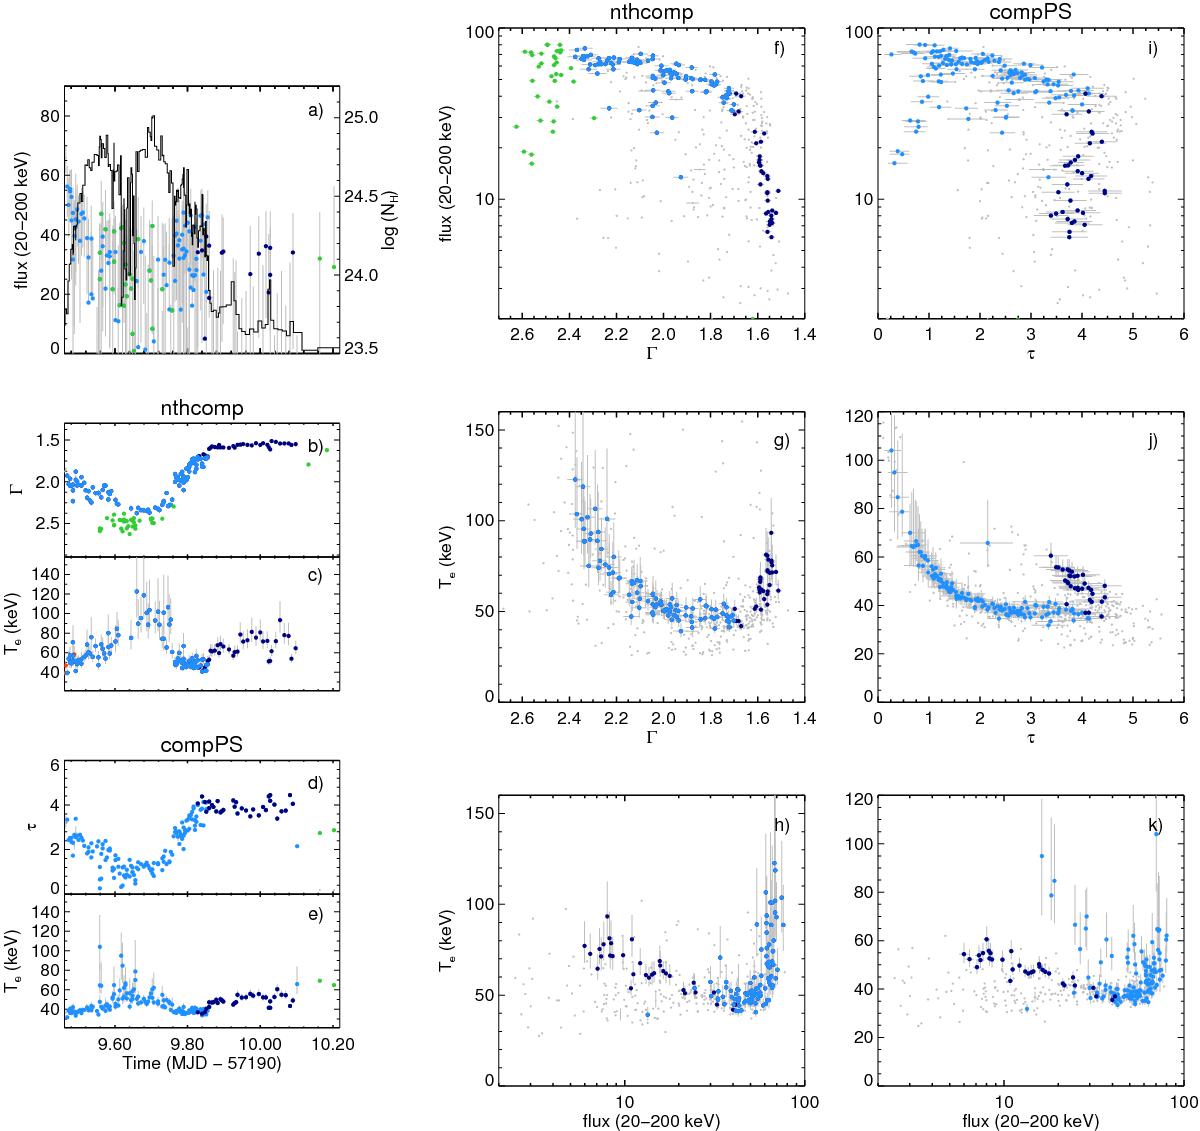
Close view of the properties of the soft X-ray flare detected around MJD 57 200, derived fitting the source spectra with Comptonization models (nthcomp and compps). Panel a) time evolution of the source flux, Fx, in the 20–200 keV energy range (× 10-8 erg cm-2 s-1) in comparison with the NH evolution, where NH was derived by leaving it as a free parameter in our fits, as described in Sect. 3.4. During the flare, when NH displayed lower values, it could not be constrained by our fits. Panels b)–e) time evolution of the spectral parameters derived for this period. Panels f)–h) relations between the various nthcomp spectral parameters during this period. Panels i)–k) relations between the various compps spectral parameters during this period. For reference, we also show in panels f)–k) the complete dataset analysed in this work (grey points). During the flare rise and decay we observed parameter correlations characteristic of the soft flaring branch (see panels f)–k), Sect. 3.3). Around the peak of the flare, the spectra softened above Γ ~ 2.4 and Te was constrained using nthcomp. Spectral fits to these data using compps provided un-constrained Te values (Te≳ 100 keV), and the lowest τ values found in this work (τ ≲ 1). These spectra occupy a region in the Γ–Fx diagram (panel f)) reminiscent of the ultra-luminous state in the BHB HID. These spectra also occupy a separate branch in the compps Fx–Te diagram (panel i)). After the peak of the flare, as Fx decreased and the spectrum hardened below Γ ~ 2.4 the system returned to the soft flaring branch. Around MJD 57 199.85 a dramatic drop in flux was observed (from Fx ~ 50 to Fx ~ 15 × 10-8 erg cm-2 s-1 in about half an hour) and the system entered the hard branch. After this transition, the system started the decay to quiescence, following the hard branch characteristic correlations, but for a decreasing flux.
Current usage metrics show cumulative count of Article Views (full-text article views including HTML views, PDF and ePub downloads, according to the available data) and Abstracts Views on Vision4Press platform.
Data correspond to usage on the plateform after 2015. The current usage metrics is available 48-96 hours after online publication and is updated daily on week days.
Initial download of the metrics may take a while.