Fig. A.1
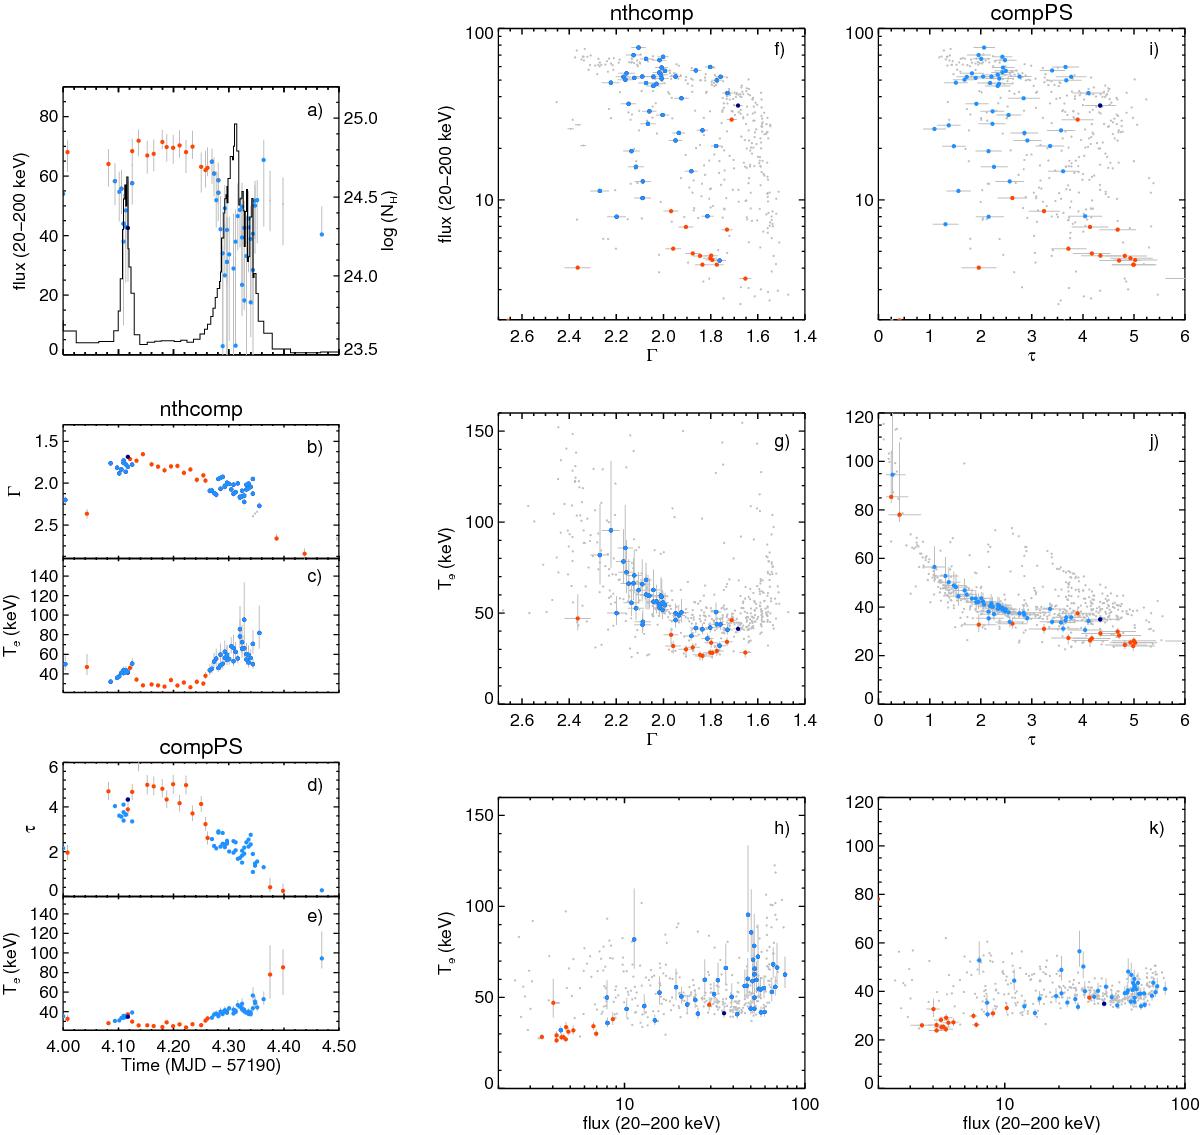
Close view of the properties of the X-ray plateau detected on MJD 57 194.0–57 194.4, derived fitting the source spectra with Comptonization models (nthcomp and compps). Panel a) time evolution of the source flux, Fx, in the 20–200 keV energy range (× 10-8 erg cm-2 s-1) in comparison with the NH evolution, where NH was derived by leaving it as a free parameter in our fits, as described in Sect. 3.4. The plateau was characterized by a roughly constant flux Fx ~ 5 × 10⁻⁸ erg cm-2 s-1 and was interrupted by two big flares around MJD 57 194.1 and 57 194.3 with peak fluxes of Fx ~ 60 and 80 × 10-8 erg cm-2 s-1. We observed roughly constant NH values during the X-ray plateau (NH ~ 5 × 1024cm-2). Systematically lower NH values were measured during the two X-ray flares. However, NH cannot be properly constrained by our fits to the flare spectra. Panels b)–e) time evolution of the spectral parameters derived for this period. Panels f)–h) relations between the various nthcomp spectral parameters during this period. Panels i)–k) relations between the various compps spectral parameters during this period. For reference, we also show in panels f)–k) the complete dataset analysed in this work (grey points). The parameters derived during the peaks of the flares occupy the soft flaring branch, (see Sect. 3.3), while the flare rise and decays, which are likely affected by partial obscuration, occupy intermediate regions between the soft flaring branch and the plateau branch in the panels f) and i).
Current usage metrics show cumulative count of Article Views (full-text article views including HTML views, PDF and ePub downloads, according to the available data) and Abstracts Views on Vision4Press platform.
Data correspond to usage on the plateform after 2015. The current usage metrics is available 48-96 hours after online publication and is updated daily on week days.
Initial download of the metrics may take a while.