Fig. 5
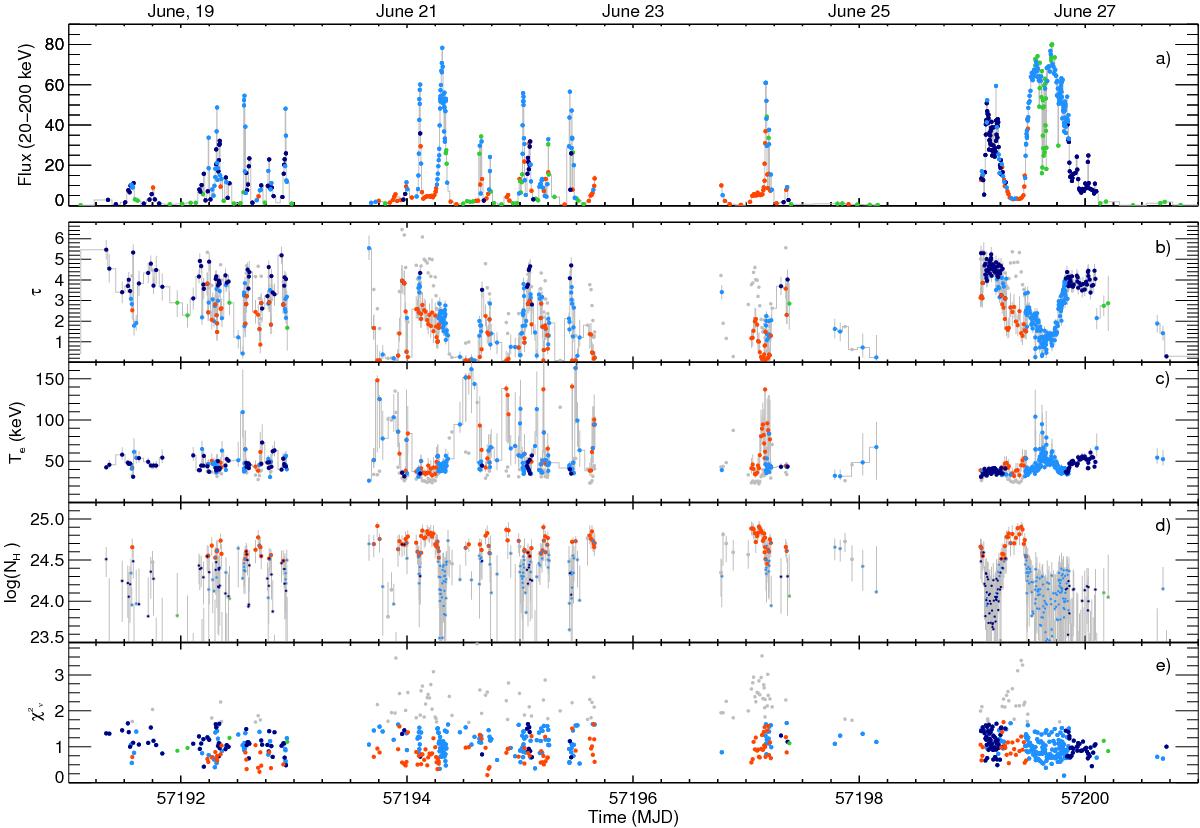
Time evolution of the flux and spectral parameters of V404 Cyg during the June 2015 flaring episodes. Green and blue symbols are unchanged with respect to Fig. 2. Red symbols highlight the parameters obtained fitting the data with a Comptonized model (compps) modified by variable absorption. The BIC model selection (see text) favours this model only for the spectra detected during the X-ray plateaus. For comparison, we also show the parameters obtained in the fits to these spectra fixing the absorption to interstellar values (grey symbols in panels b), c) and e). Panel a) source flux (20–200 keV) in units of 10-8 erg cm-2 s-1. Panel b) optical depth, τ, Panel c) electron temperature, Te. Panel d) NH values obtained for the whole data set when leaving NH as a free parameter; only when NH ≳ 1024 cm-2 modifies substantially the spectral shape in the IBIS/ISGRI energy range, can this value be properly constrained in our spectral fits. This happens during the X-ray plateaus. Panel e) ![]() value for every fit.
value for every fit.
Current usage metrics show cumulative count of Article Views (full-text article views including HTML views, PDF and ePub downloads, according to the available data) and Abstracts Views on Vision4Press platform.
Data correspond to usage on the plateform after 2015. The current usage metrics is available 48-96 hours after online publication and is updated daily on week days.
Initial download of the metrics may take a while.