Fig. 4
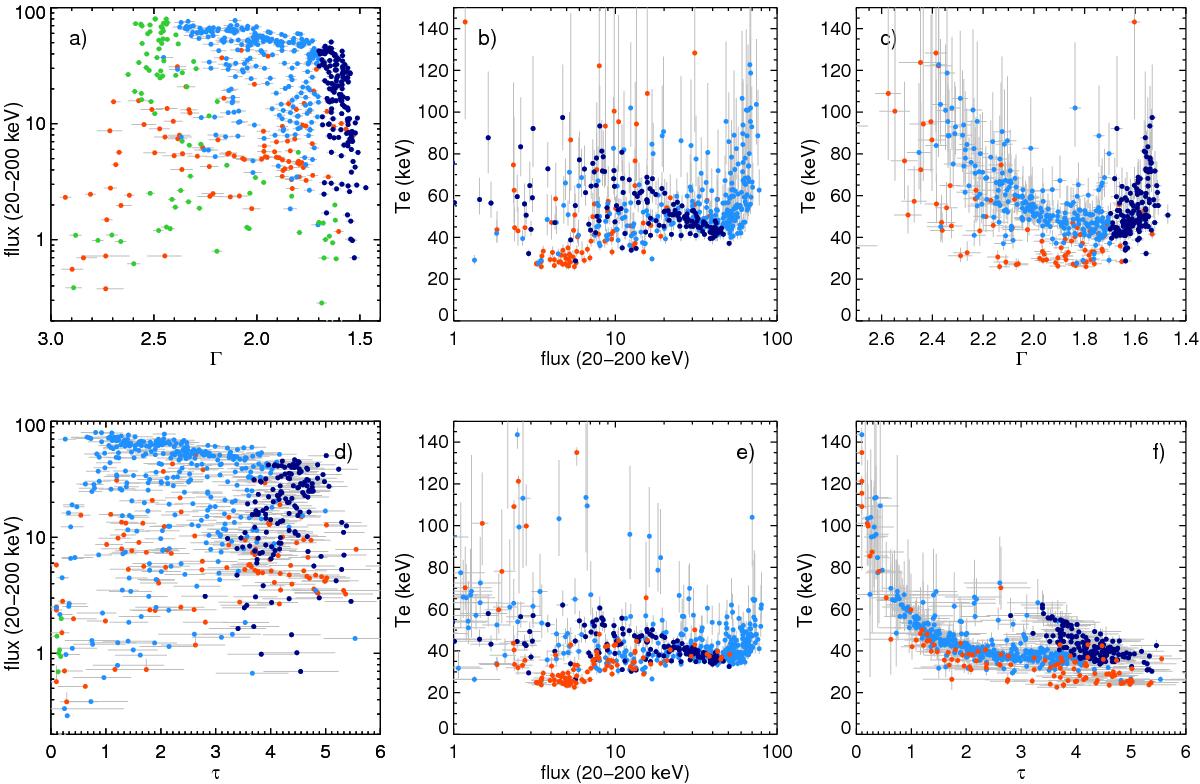
Relations between the parameters derived from our spectral fits, via the nthcomp (panels a)–c)) and compps models (panels d)–f)). Green, blue and red symbols are used to highlight the best-fitting model, according to our model selection criteria (Sect. 2.2). Blue: comptonization models with constrained Te (Fig. 1a) further divided into hard (Γ ≤ 1.7; dark blue) and soft spectra (Γ > 1.7; light blue). Green: Comptonization models with unconstrained Te (Fig. 1b). Red: p–value <0.05 fits. (Fig. 1c). Panel a) Fx−Γ diagram. We find a hard branch (dark blue points) where Fx and Γ are correlated, similar to the hard state in the BHB HID. At the highest fluxes in the outburst, we find the soft flaring branch (light blue points), similar to the BHB HID intermediate states. We also identify the softest spectra in our sample (Γ ≳ 2.4) with unconstrained Te with a tentative ultra-luminous state (green points). The different branches also occupy characteristic regions in panel d) Fx−τ diagram, panels b, e), Fx–Te diagrams, panel c) Γ −Te diagram and panel f) τ −Te diagram. The various parameter correlations are described in detail in Sect. 3.3.
Current usage metrics show cumulative count of Article Views (full-text article views including HTML views, PDF and ePub downloads, according to the available data) and Abstracts Views on Vision4Press platform.
Data correspond to usage on the plateform after 2015. The current usage metrics is available 48-96 hours after online publication and is updated daily on week days.
Initial download of the metrics may take a while.