Fig. 3
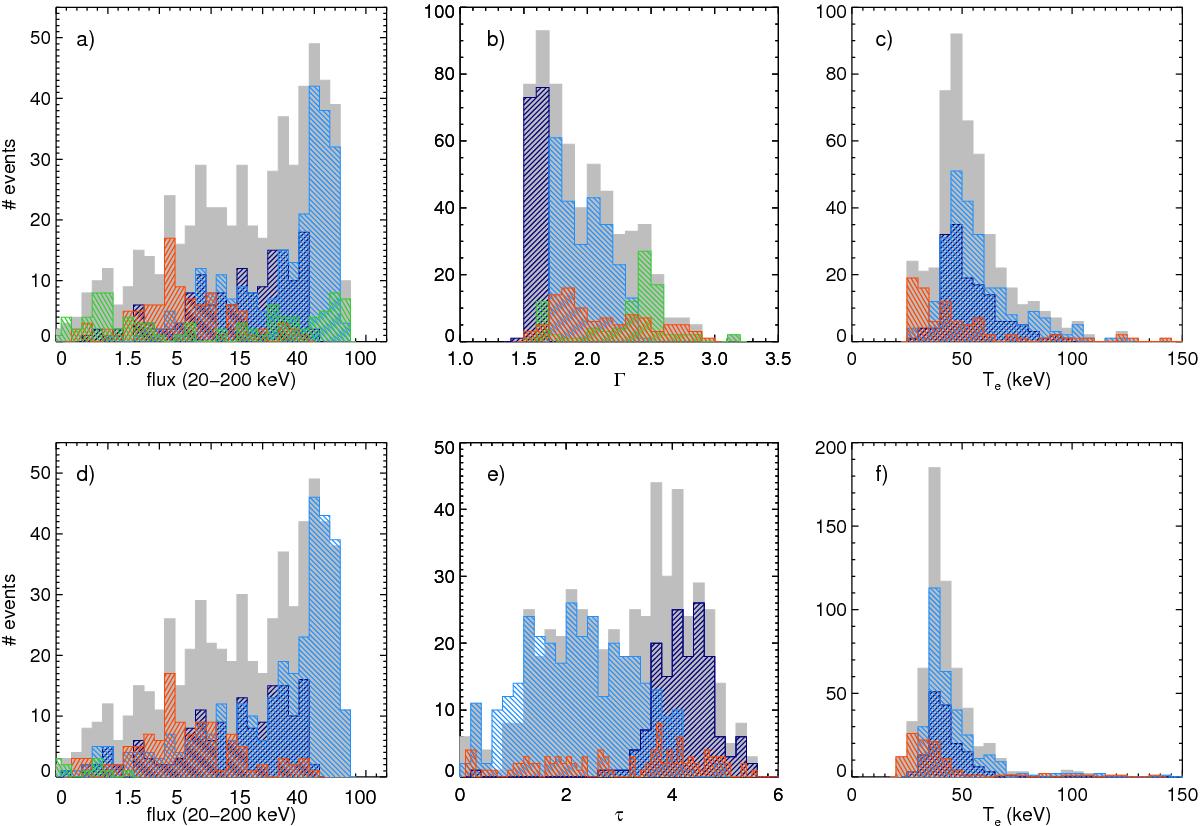
Distribution of the spectral parameters obtained in the fits to the IBIS/ISGRI spectra of V404 Cyg analysed in this work. Grey bars are used to describe the total parameter distribution. Green, blue, and red symbols are used to highlight the best-fitting model, according to our model selection criteria (Sect. 2.2). Blue: comptonization models with constrained Te (Fig. 1a) further divided into hard (Γ ≤ 1.7; dark blue) and soft spectra (Γ > 1.7; light blue). Green: comptonization models with unconstrained Te (Fig. 1b). Red: p–value <0.05 fits. (Fig. 1c). In the top panels we show the distribution of the nthcomp parameters, while in the bottom panels we show the compps parameters.
Current usage metrics show cumulative count of Article Views (full-text article views including HTML views, PDF and ePub downloads, according to the available data) and Abstracts Views on Vision4Press platform.
Data correspond to usage on the plateform after 2015. The current usage metrics is available 48-96 hours after online publication and is updated daily on week days.
Initial download of the metrics may take a while.