Fig. 2
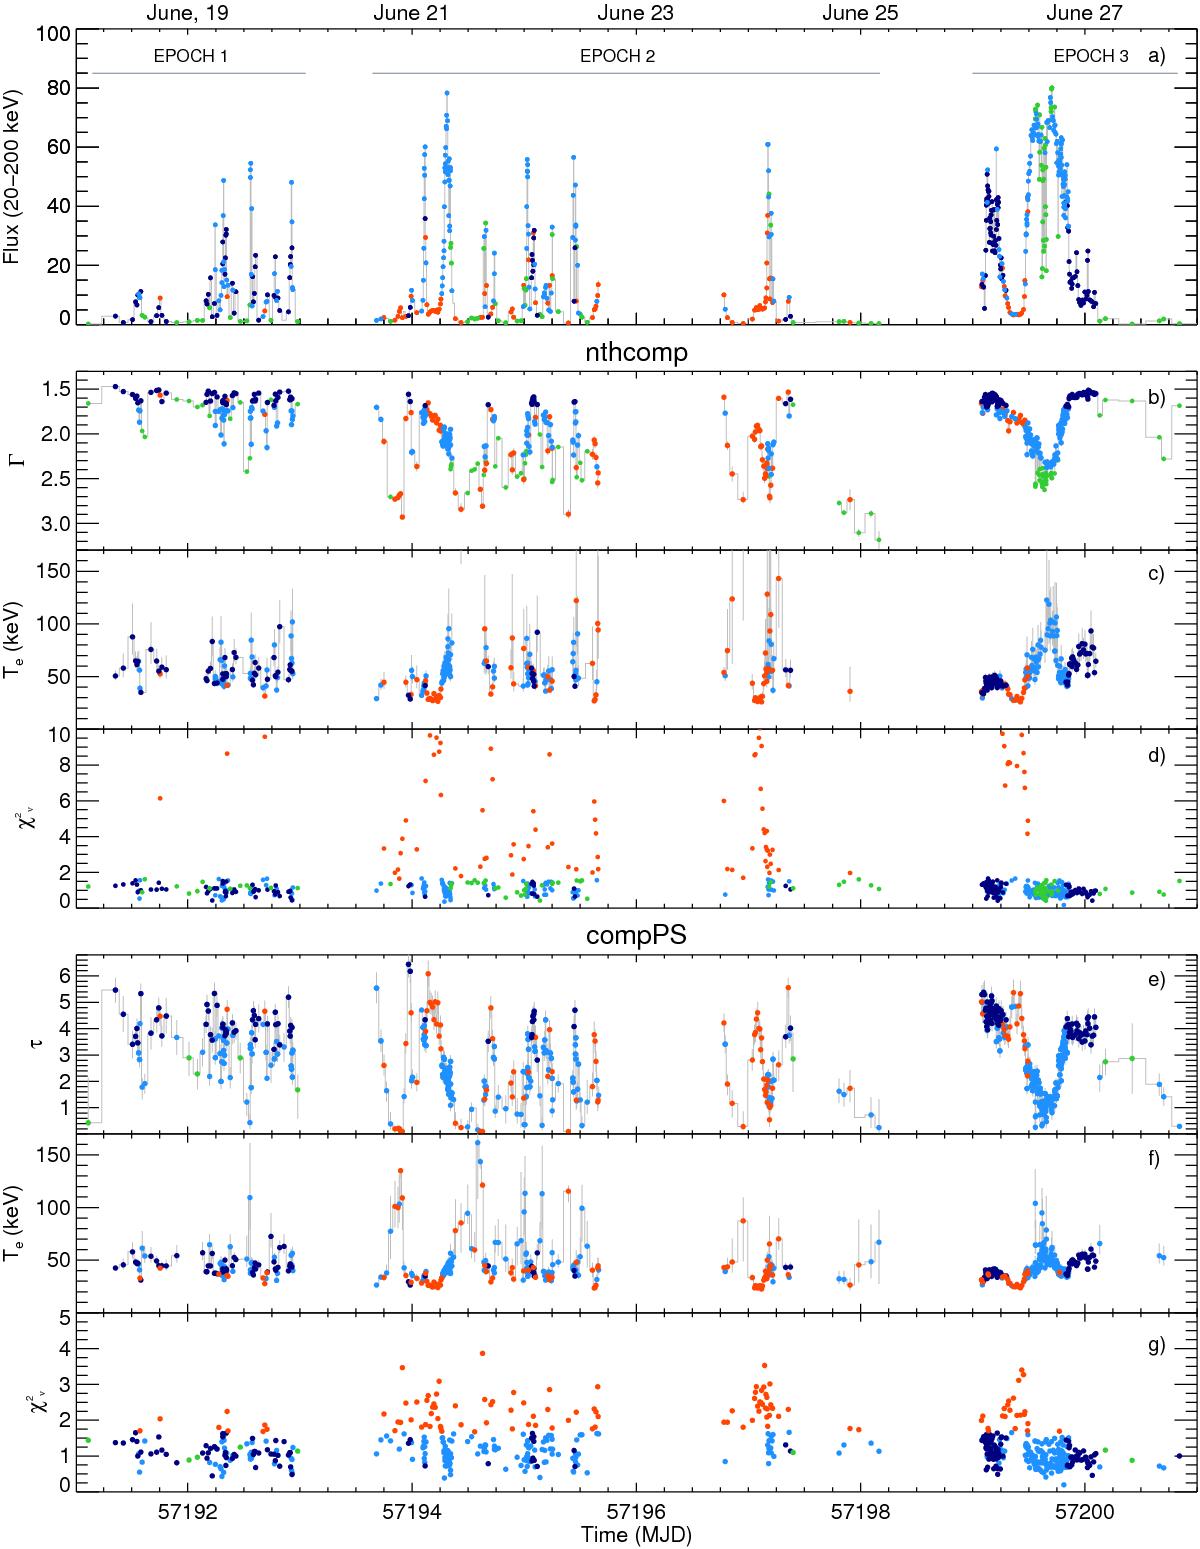
Evolution of the flux and spectral parameters of V404 Cyg during the June 2015 flaring episodes. Panel a) source flux (20–200 keV) in units of 10-8 erg cm-2 s-1. Panels b), c), d) nthcomp fitting parameters (power-law index, Γ, electron temperature, Te and ![]() ). Panels e), f), g) compps fitting parameters (optical depth, τ, electron temperature, Te and
). Panels e), f), g) compps fitting parameters (optical depth, τ, electron temperature, Te and ![]() ). Green, blue and red symbols are used to highlight the best-fitting model, according to our model selection criteria (Sect. 2.2). Blue: comptonization models with constrained Te (Fig. 1a) further divided into hard (Γ ≤ 1.7; dark blue) and soft spectra (Γ > 1.7; light blue). Green: comptonization models with unconstrained Te (Fig. 1b). Red: comptonization models with p–value <0.05 fits. (Fig. 1c);
). Green, blue and red symbols are used to highlight the best-fitting model, according to our model selection criteria (Sect. 2.2). Blue: comptonization models with constrained Te (Fig. 1a) further divided into hard (Γ ≤ 1.7; dark blue) and soft spectra (Γ > 1.7; light blue). Green: comptonization models with unconstrained Te (Fig. 1b). Red: comptonization models with p–value <0.05 fits. (Fig. 1c); ![]() ≳ 2 values are only obtained during the X-ray plateaus observed at Fx ~ 5 × 10⁻⁸ erg cm-2 s-1.
≳ 2 values are only obtained during the X-ray plateaus observed at Fx ~ 5 × 10⁻⁸ erg cm-2 s-1.
Current usage metrics show cumulative count of Article Views (full-text article views including HTML views, PDF and ePub downloads, according to the available data) and Abstracts Views on Vision4Press platform.
Data correspond to usage on the plateform after 2015. The current usage metrics is available 48-96 hours after online publication and is updated daily on week days.
Initial download of the metrics may take a while.