Free Access
Fig. 4
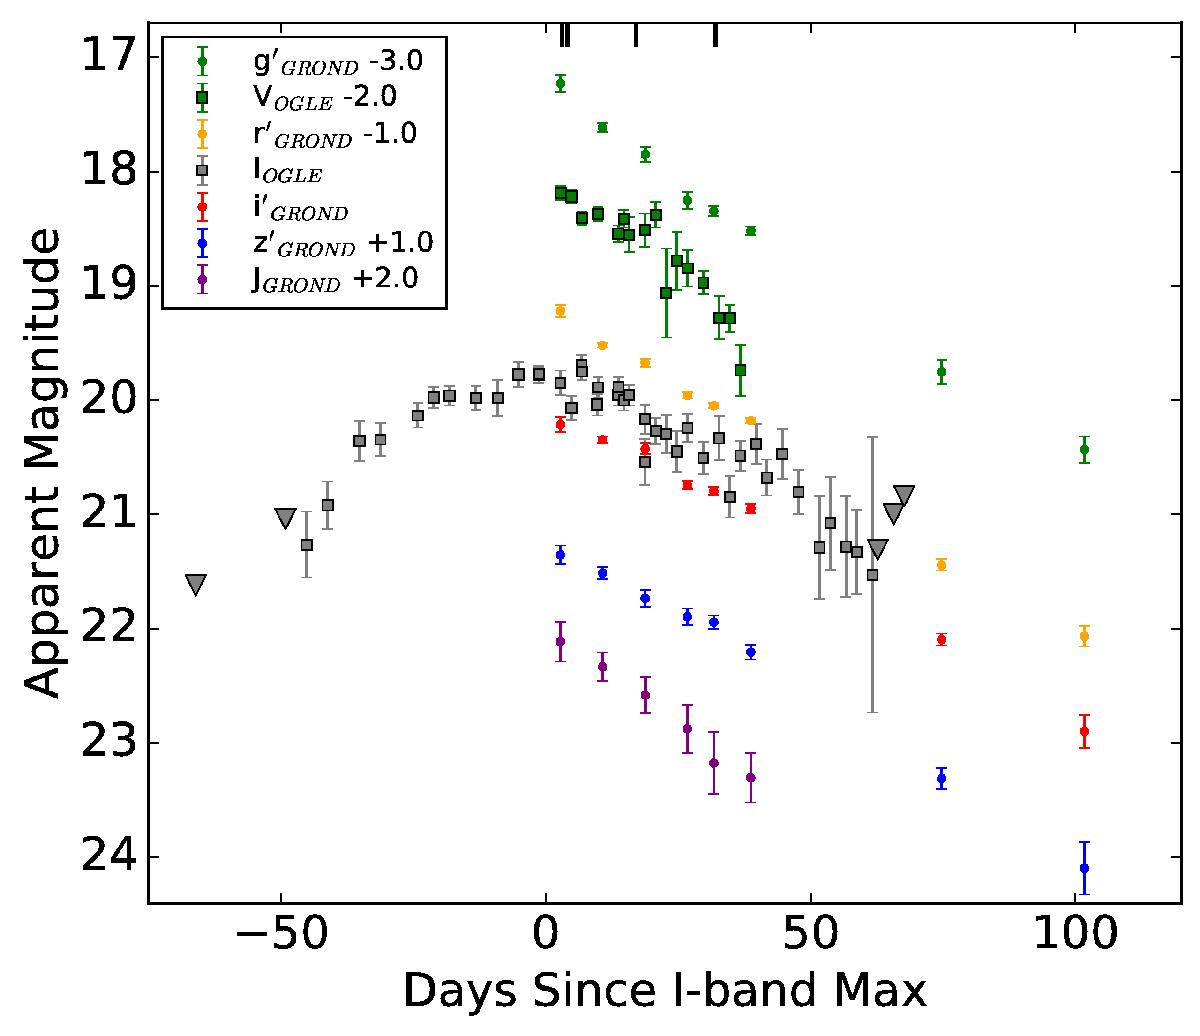
Observed light curves of OGLE-2014-SN-131 in different bands, shifted for easier viewing. The epochs of the obtained spectra have been marked with vertical dashes. I-band limits are indicated with gray triangles.
Current usage metrics show cumulative count of Article Views (full-text article views including HTML views, PDF and ePub downloads, according to the available data) and Abstracts Views on Vision4Press platform.
Data correspond to usage on the plateform after 2015. The current usage metrics is available 48-96 hours after online publication and is updated daily on week days.
Initial download of the metrics may take a while.