Fig. 3
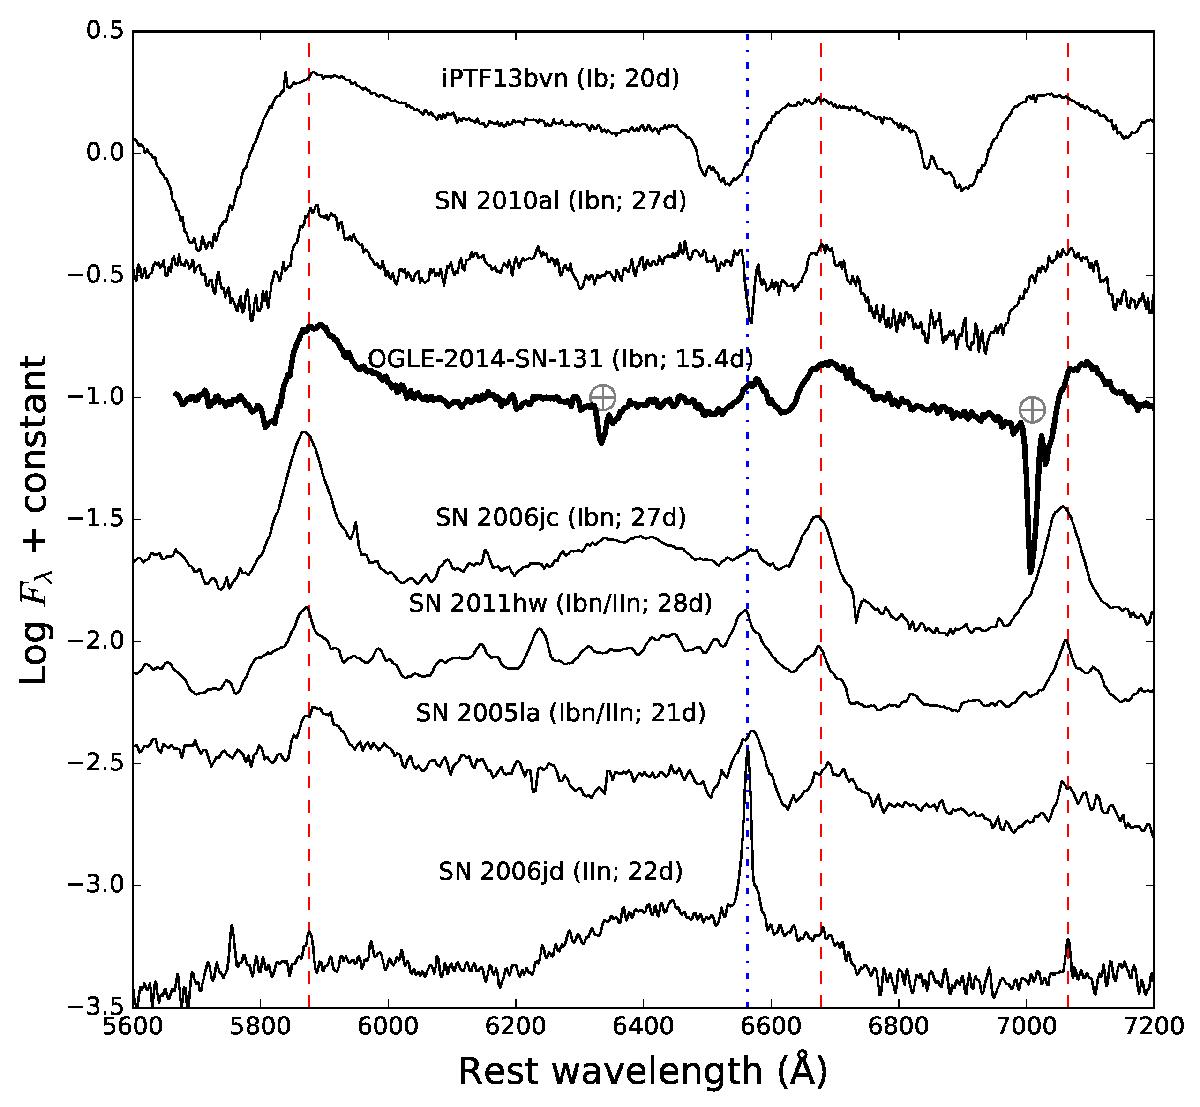
Spectral comparison of OGLE-2014-SN-131 with a sample of SN spectra obtained a few weeks after maximum. The sample includes the Type Ib SN iPTF13bvn (Fremling et al. 2014); the Type Ibn SNe 2010al (Pastorello et al. 2015a) and 2006jc (Pastorello et al. 2008); the Type Ibn/IIn SNe 2011hw and 2005la (Pastorello et al. 2015a); and the Type IIn SN 2006jd (Stritzinger et al. 2012). The locations of the prominent He i lines and that of Hα have been marked with red dashed, and a blue dot-dashed line, respectively. This figure is adapted from Pastorello et al. (2015a, their Fig. 11). Phases in parenthesis are rest-frame days since maximum. The main telluric features of our spectrum are marked with crossed-circles.
Current usage metrics show cumulative count of Article Views (full-text article views including HTML views, PDF and ePub downloads, according to the available data) and Abstracts Views on Vision4Press platform.
Data correspond to usage on the plateform after 2015. The current usage metrics is available 48-96 hours after online publication and is updated daily on week days.
Initial download of the metrics may take a while.