Fig. 2
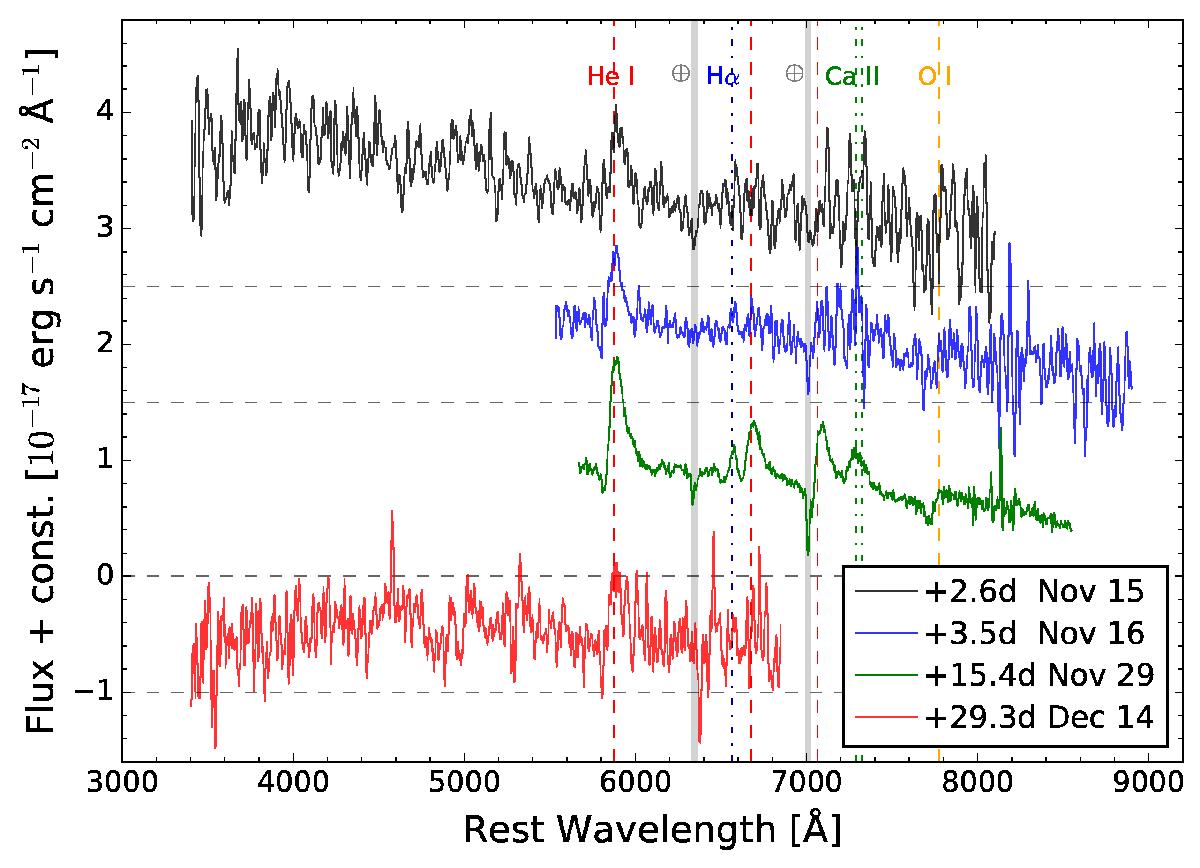
Spectral evolution of OGLE-2014-SN-131. Four spectra were taken with the NTT and the VLT, all showing the prominent He i feature at 5876 Å. The zero flux level of each shifted spectrum is indicated with a dashed line. The line identifications from Sect. 4 are indicated with a red dashed line for He i, blue dot-dashed line for Hα, a green dotted line for Ca ii, and a gold dashed line for O i. The spectra have not been corrected for reddening due to extinction.
Current usage metrics show cumulative count of Article Views (full-text article views including HTML views, PDF and ePub downloads, according to the available data) and Abstracts Views on Vision4Press platform.
Data correspond to usage on the plateform after 2015. The current usage metrics is available 48-96 hours after online publication and is updated daily on week days.
Initial download of the metrics may take a while.