Fig. 11
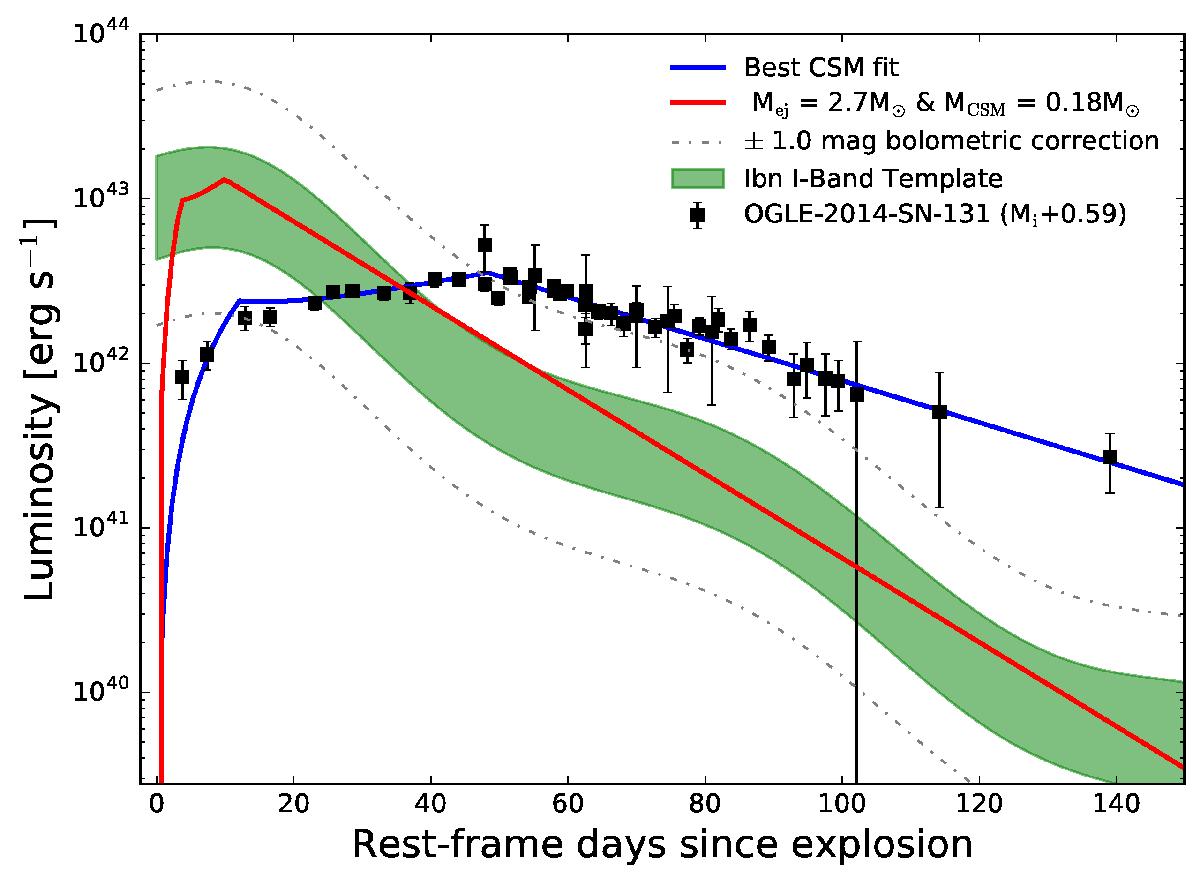
CSM interaction models compared to the light curve of OGLE-2014-SN-131 and the I band SN Ibn template. The only difference between the two models is that the latter (red line) had its ejecta mass and CSM mass reduced by 85% and 65%, respectively. No other parameter has been changed. Since we do not know the average I-band bolometric correction for a SN Ibn, we also plot the 1-sigma I-band template with ±1.0 mag bolometric correction. The model would still be consistent with the template after we apply this bolometric correction, if we allow the explosion energy to change by ± 30% (see Sect. 6.3).
Current usage metrics show cumulative count of Article Views (full-text article views including HTML views, PDF and ePub downloads, according to the available data) and Abstracts Views on Vision4Press platform.
Data correspond to usage on the plateform after 2015. The current usage metrics is available 48-96 hours after online publication and is updated daily on week days.
Initial download of the metrics may take a while.