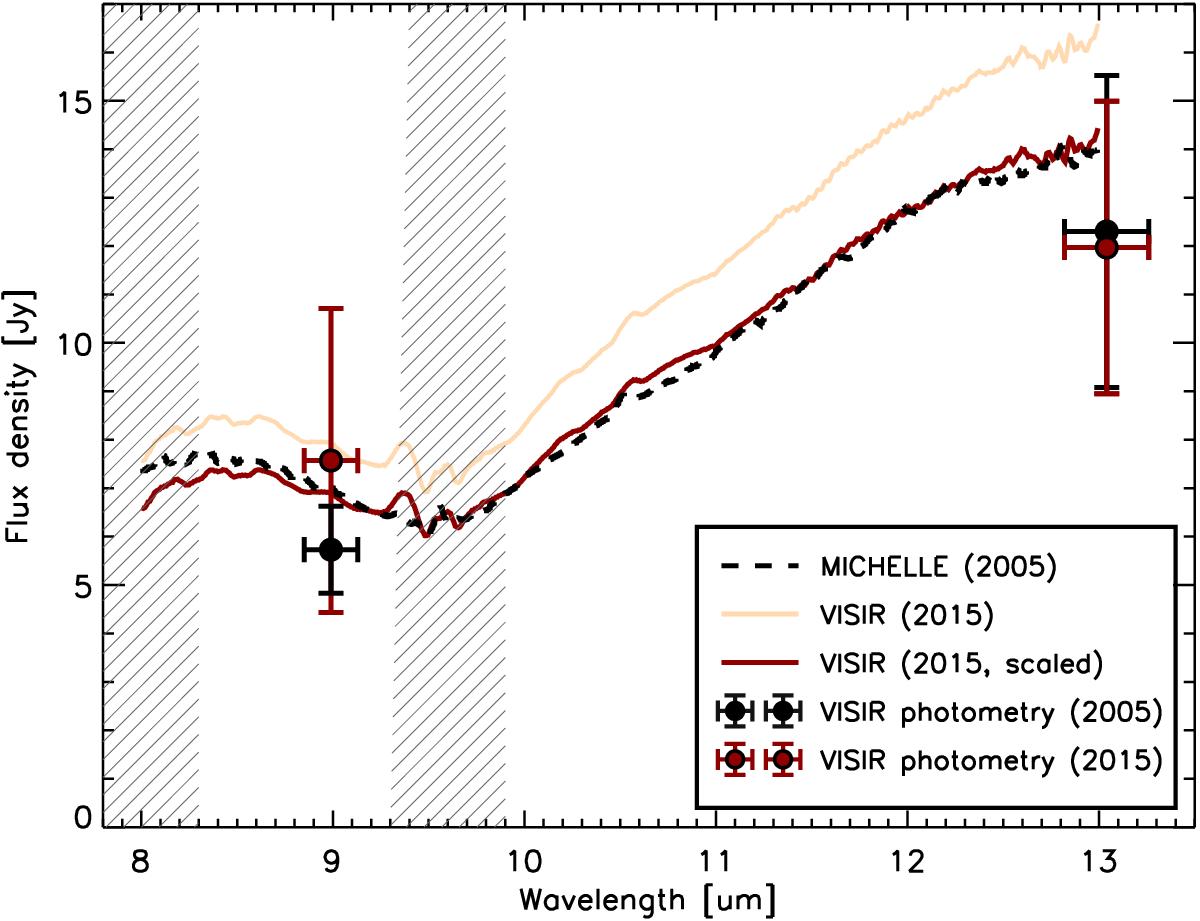
Fig. 2

Nuclear mid-infrared spectrophotometry of NGC 1068 from single-dish observations. We include spectra and fluxes from two epochs: before (from 2005) and after (from 2015) the detection of X-ray variability. The spectral regions close to 8 μm and 9.5 μm are affected by strong atmospheric absorption (shaded areas), and these regions should be ignored. The spectra have been smoothed to improve readability. See Sect. 3.1 for more details.
Current usage metrics show cumulative count of Article Views (full-text article views including HTML views, PDF and ePub downloads, according to the available data) and Abstracts Views on Vision4Press platform.
Data correspond to usage on the plateform after 2015. The current usage metrics is available 48-96 hours after online publication and is updated daily on week days.
Initial download of the metrics may take a while.


