Fig. 5
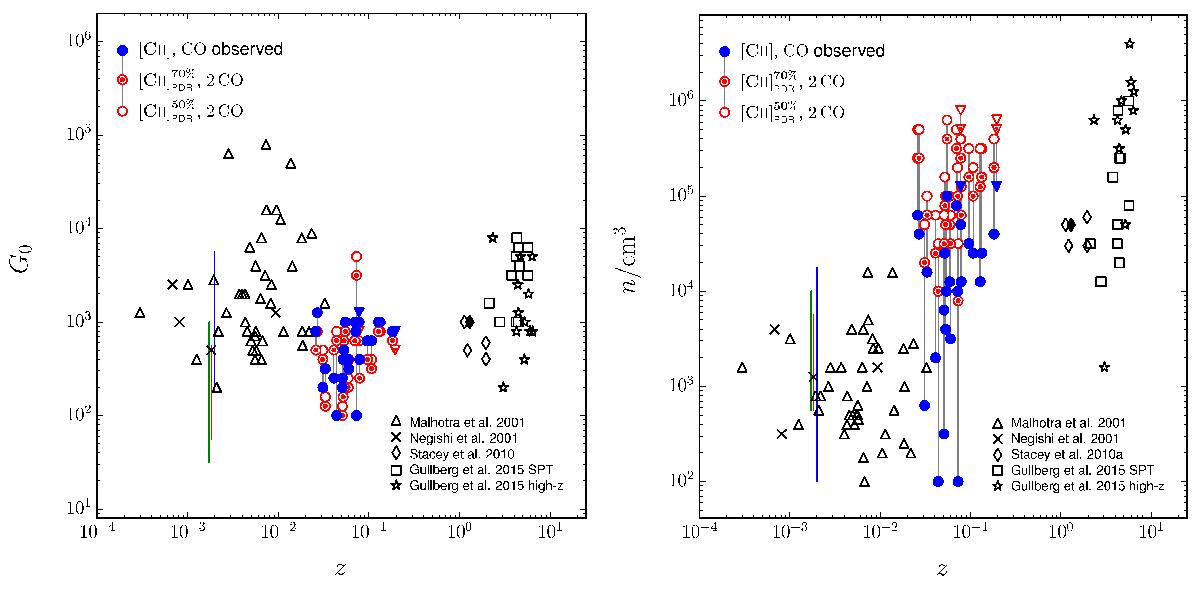
Average G0 (left panel) and n (right panel) plotted as a function of galaxy redshift. We compare the values derived from our unadjusted observations (blue solid circles) and observations including the adjustments applied to the [Cii] and CO(1–0) emission (see ), assuming either 70% (red semi-open circles) or 50% (red open circles) of the total [Cii] emission arises from PDR regions. Downward triangles represent upper limits. Comparative galaxy samples of the literature are shown with the symbols specified in the legends, together with the ranges seen in spatially resolved studies of M 51 (blue line; Parkin et al. 2013), Cen A (red line; Parkin et al. 2014) and NGC 891 (green line; Hughes et al. 2015). To facilitate a comparison, we apply the same standard adjustments (i.e. adopting ![]() and 2CO) to the high redshift (z> 1) systems as those made for galaxies at lower redshift.
and 2CO) to the high redshift (z> 1) systems as those made for galaxies at lower redshift.
Current usage metrics show cumulative count of Article Views (full-text article views including HTML views, PDF and ePub downloads, according to the available data) and Abstracts Views on Vision4Press platform.
Data correspond to usage on the plateform after 2015. The current usage metrics is available 48-96 hours after online publication and is updated daily on week days.
Initial download of the metrics may take a while.