Fig. 4
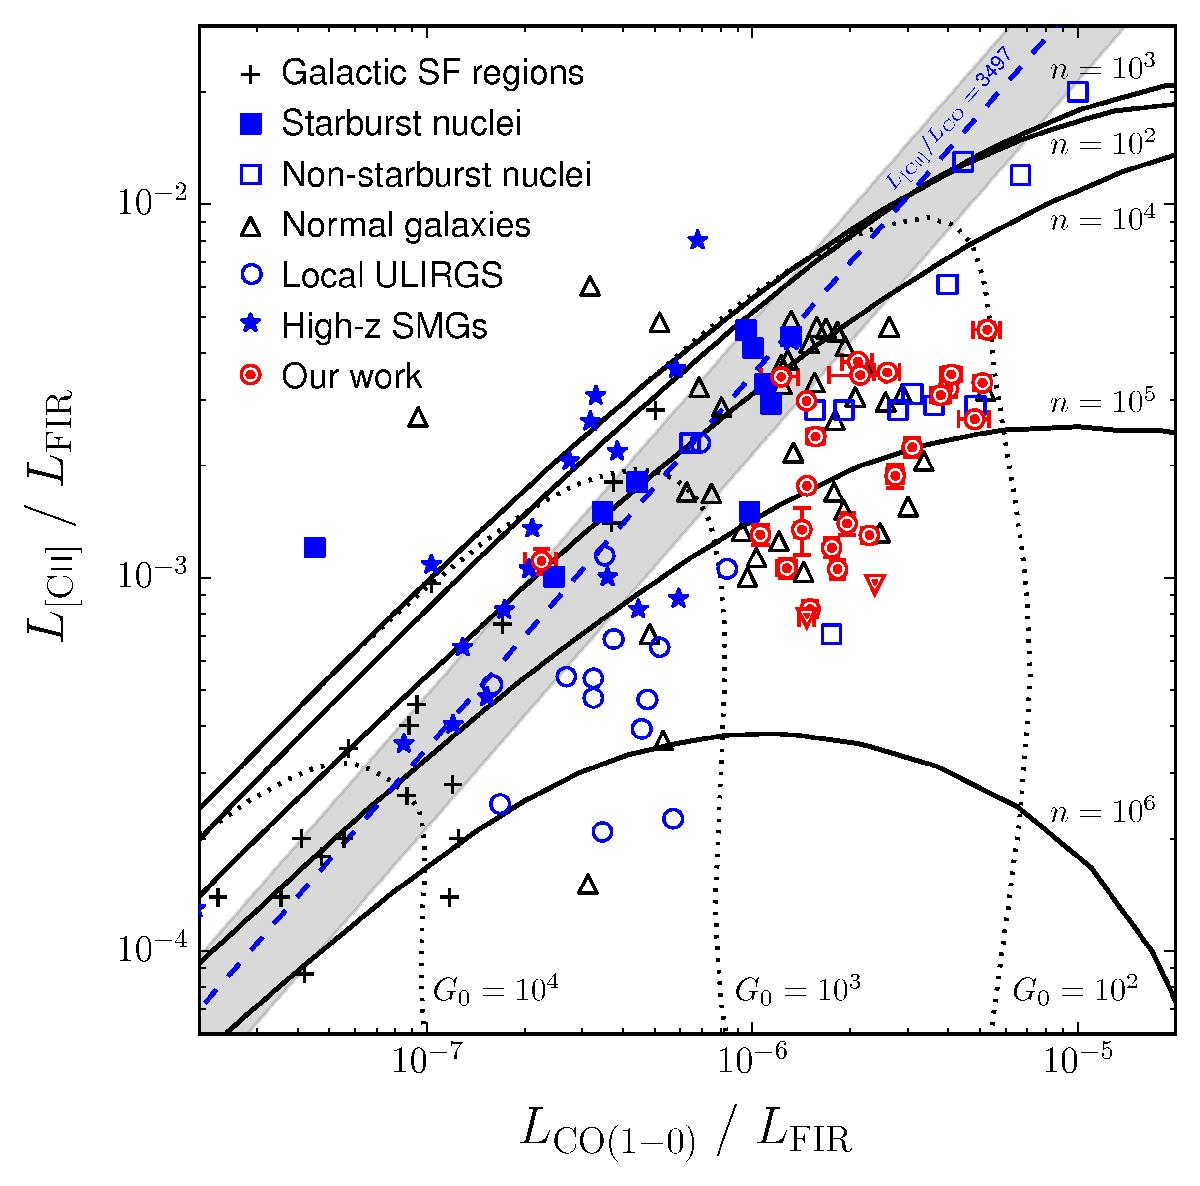
Diagnostic diagram of the L[Cii]/LFIR vs. LCO/LFIR ratios (see also caption). We superimpose our adjusted observations, assuming 70% of the total [Cii] emission arises from PDR regions (red semi-open circles), onto the grid of constant hydrogen nuclei density, log n (black solid lines), and FUV radiation field strength, log G0 (black dotted lines), determined from the PDR model of Kaufman et al. (1999, 2006). Downward triangles represent upper limits. The comparative galaxy samples of Hailey-Dunsheath et al. (2010), where this figure is adapted from, are also shown with the corresponding symbols in the legend. The high-z submillimetre galaxies (blue stars) are from Gullberg et al. (2015). The grey shaded region denotes the 1σ spread in the mean observed L[Cii]/LCO ratio (blue dashed line).
Current usage metrics show cumulative count of Article Views (full-text article views including HTML views, PDF and ePub downloads, according to the available data) and Abstracts Views on Vision4Press platform.
Data correspond to usage on the plateform after 2015. The current usage metrics is available 48-96 hours after online publication and is updated daily on week days.
Initial download of the metrics may take a while.