Fig. 3
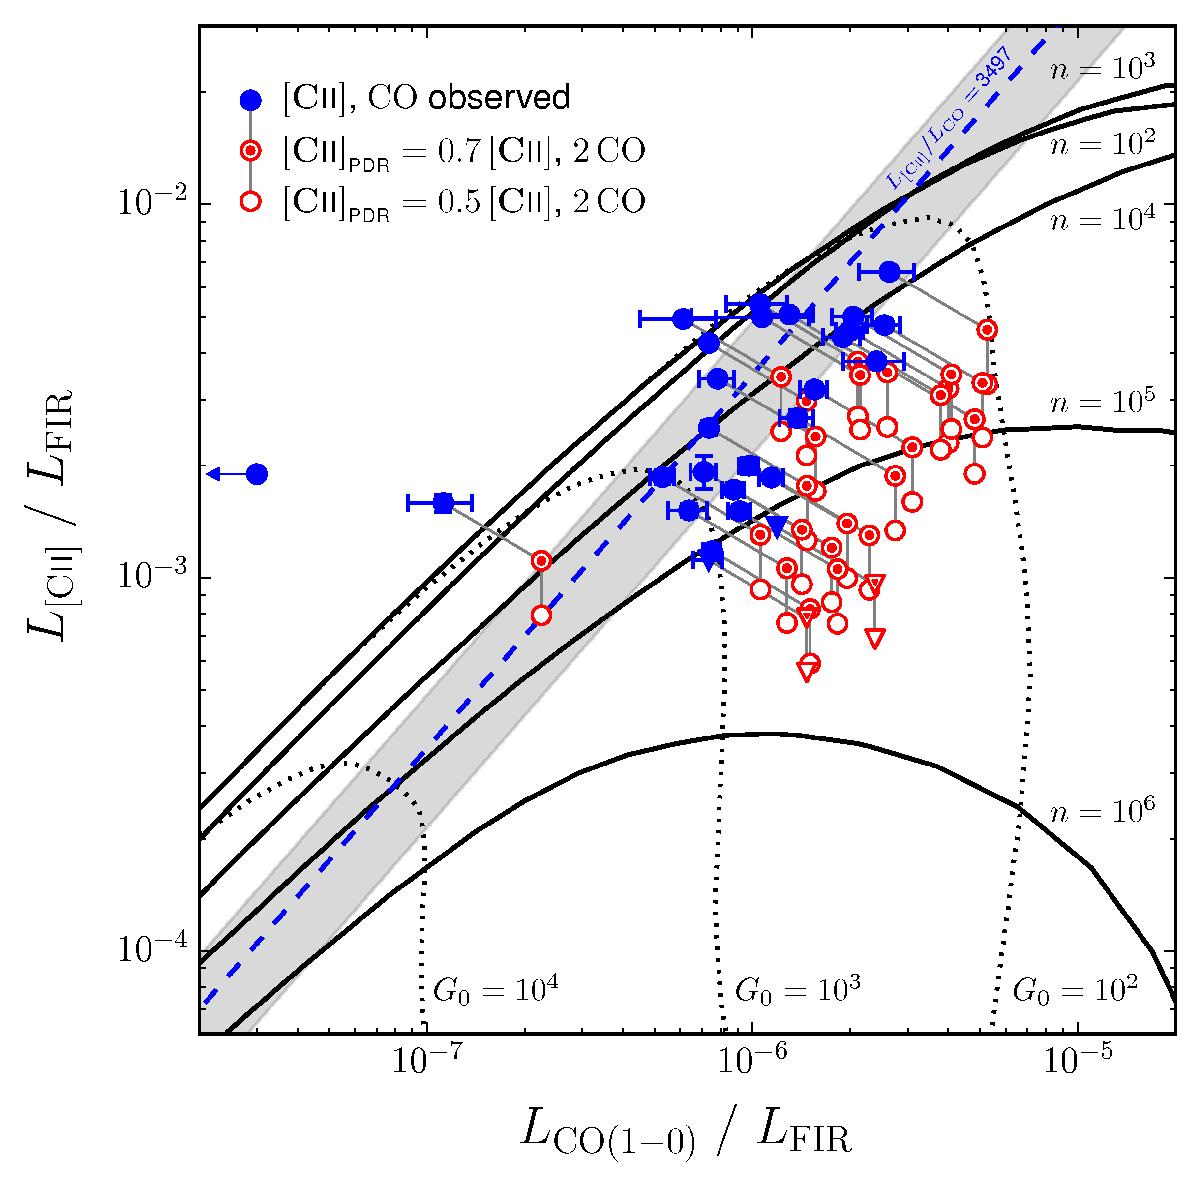
Diagnostic diagram of the observed L[Cii]/LFIR ratio vs. LCO/LFIR ratio for our sample. The observations are superimposed onto the grid of constant hydrogen nuclei density, log n (black solid lines), and FUV radiation field strength, log G0 (black dotted lines), determined from the PDR model of Kaufman et al. (1999, 2006). The unadjusted observations (blue solid circles) are compared to the adjusted observations, as described in , where the fraction of the [Cii] emission arising from neutral gas is fixed at 70% (red semi-open circles) and 50% (red open circles). Downward triangles represent 5σ upper limits. Two sources lie above the log n = 2 contour, i.e. outside the model parameter space, and the blue arrow points towards G09.DR1.328, which remains outside the plot regardless of adjustments. The grey shaded region denotes the 1σ spread in the mean observed L[Cii]/LCO ratio (blue dashed line). This figure is adapted from Stacey et al. (2010a) and Hailey-Dunsheath et al. (2010).
Current usage metrics show cumulative count of Article Views (full-text article views including HTML views, PDF and ePub downloads, according to the available data) and Abstracts Views on Vision4Press platform.
Data correspond to usage on the plateform after 2015. The current usage metrics is available 48-96 hours after online publication and is updated daily on week days.
Initial download of the metrics may take a while.