Fig. 2
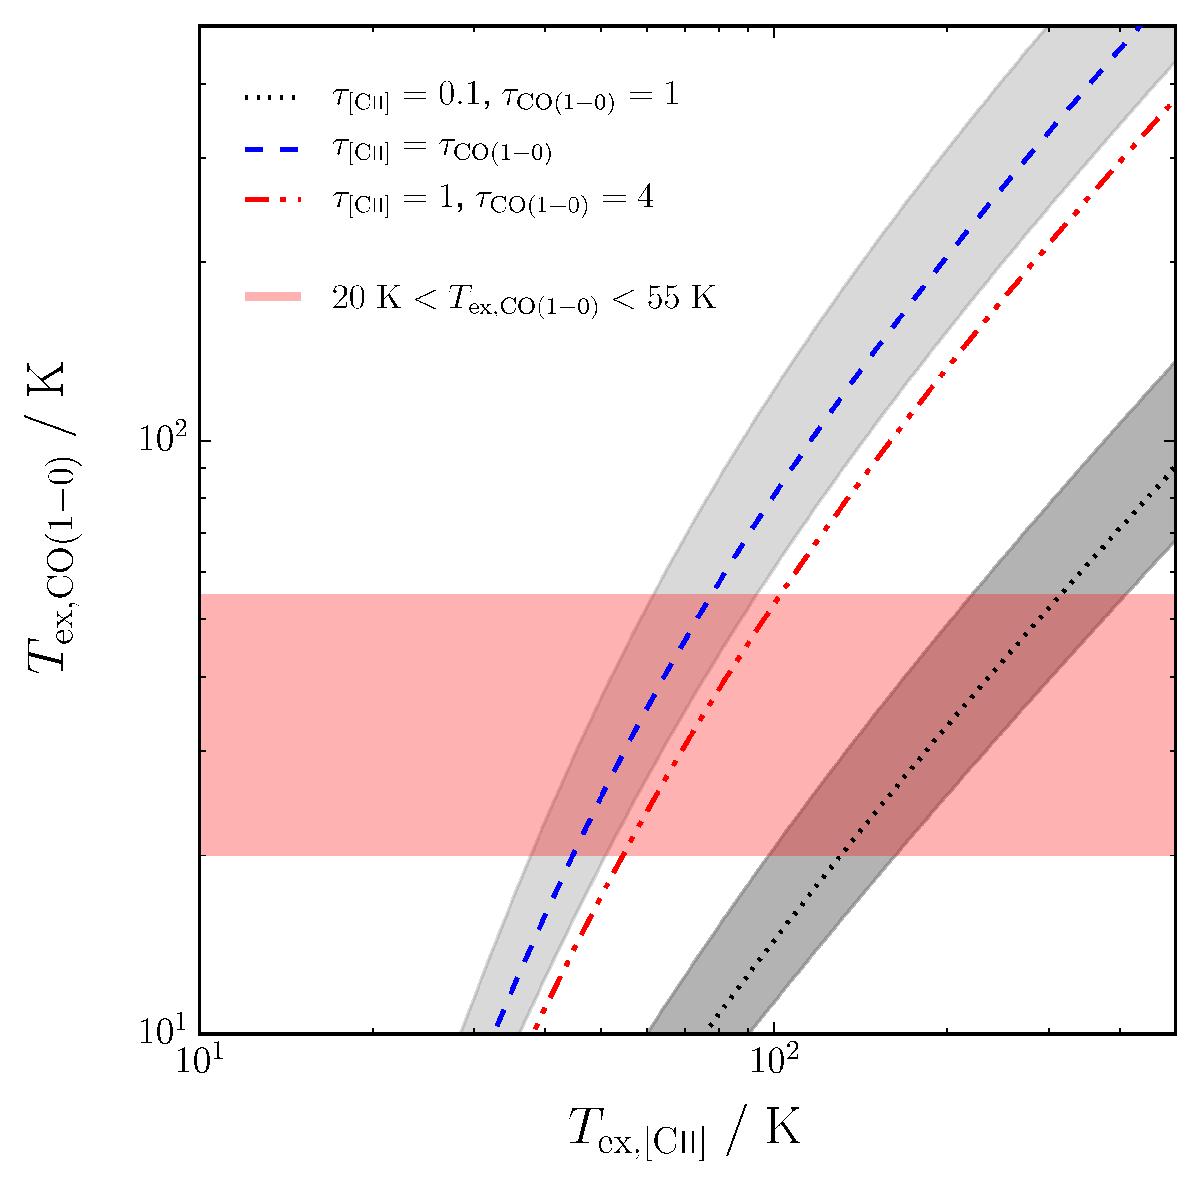
CO(1–0) vs. [Cii] excitation temperatures determined via the ratio of the source functions ()) assuming various line opacities, as specified in the legend, and adopting the observed L[Cii]/LCO ratio of 3500. The light and dark grey shaded regions denote denotes the 1σ spread in the mean observed ratio, whereas the red shaded region represents the CO excitation temperatures of 20 K <Tex,CO(1−0)< 55 K. Combined with the results of PDR modelling and previous observational evidence in the literature (), the best scenario to explain the observed L[Cii]/LCO ratios is gas where Tex, [Cii]>Tex,CO(1−0) and with [Cii] is optically thin and the CO is optically thick (τ[Cii] = 0.1, τCO(1−0) = 1; black dotted line).
Current usage metrics show cumulative count of Article Views (full-text article views including HTML views, PDF and ePub downloads, according to the available data) and Abstracts Views on Vision4Press platform.
Data correspond to usage on the plateform after 2015. The current usage metrics is available 48-96 hours after online publication and is updated daily on week days.
Initial download of the metrics may take a while.