Fig. 1
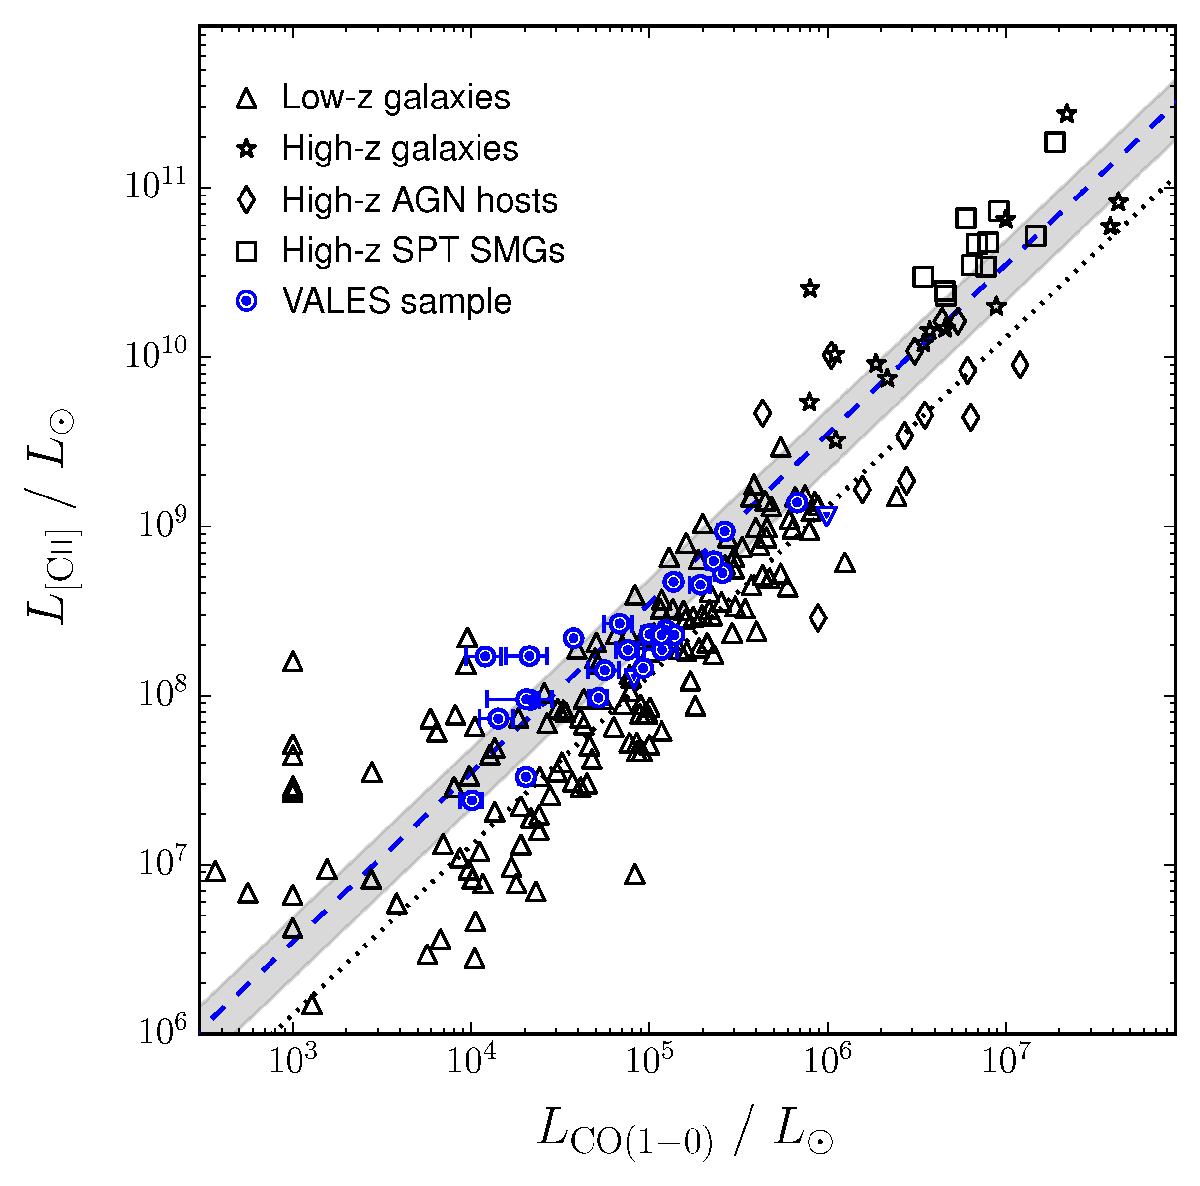
[Cii] luminosity vs. the CO(1–0) luminosity for the VALES sample at 0.03 <z< 0.2 superimposed on the low- and high-z samples taken from Fig. 7 of Gullberg et al. (2015), with symbols as specified in the legend. Downward triangles represent 5σ upper limits. The grey shaded region the 1σ spread in the mean observed L[Cii]/LCO ratio (3500 ± 1200; blue dashed line) of our sample, which we compare to the mean ratios of the low-z sample (1300 ± 440; black dotted line).
Current usage metrics show cumulative count of Article Views (full-text article views including HTML views, PDF and ePub downloads, according to the available data) and Abstracts Views on Vision4Press platform.
Data correspond to usage on the plateform after 2015. The current usage metrics is available 48-96 hours after online publication and is updated daily on week days.
Initial download of the metrics may take a while.