Fig. 4
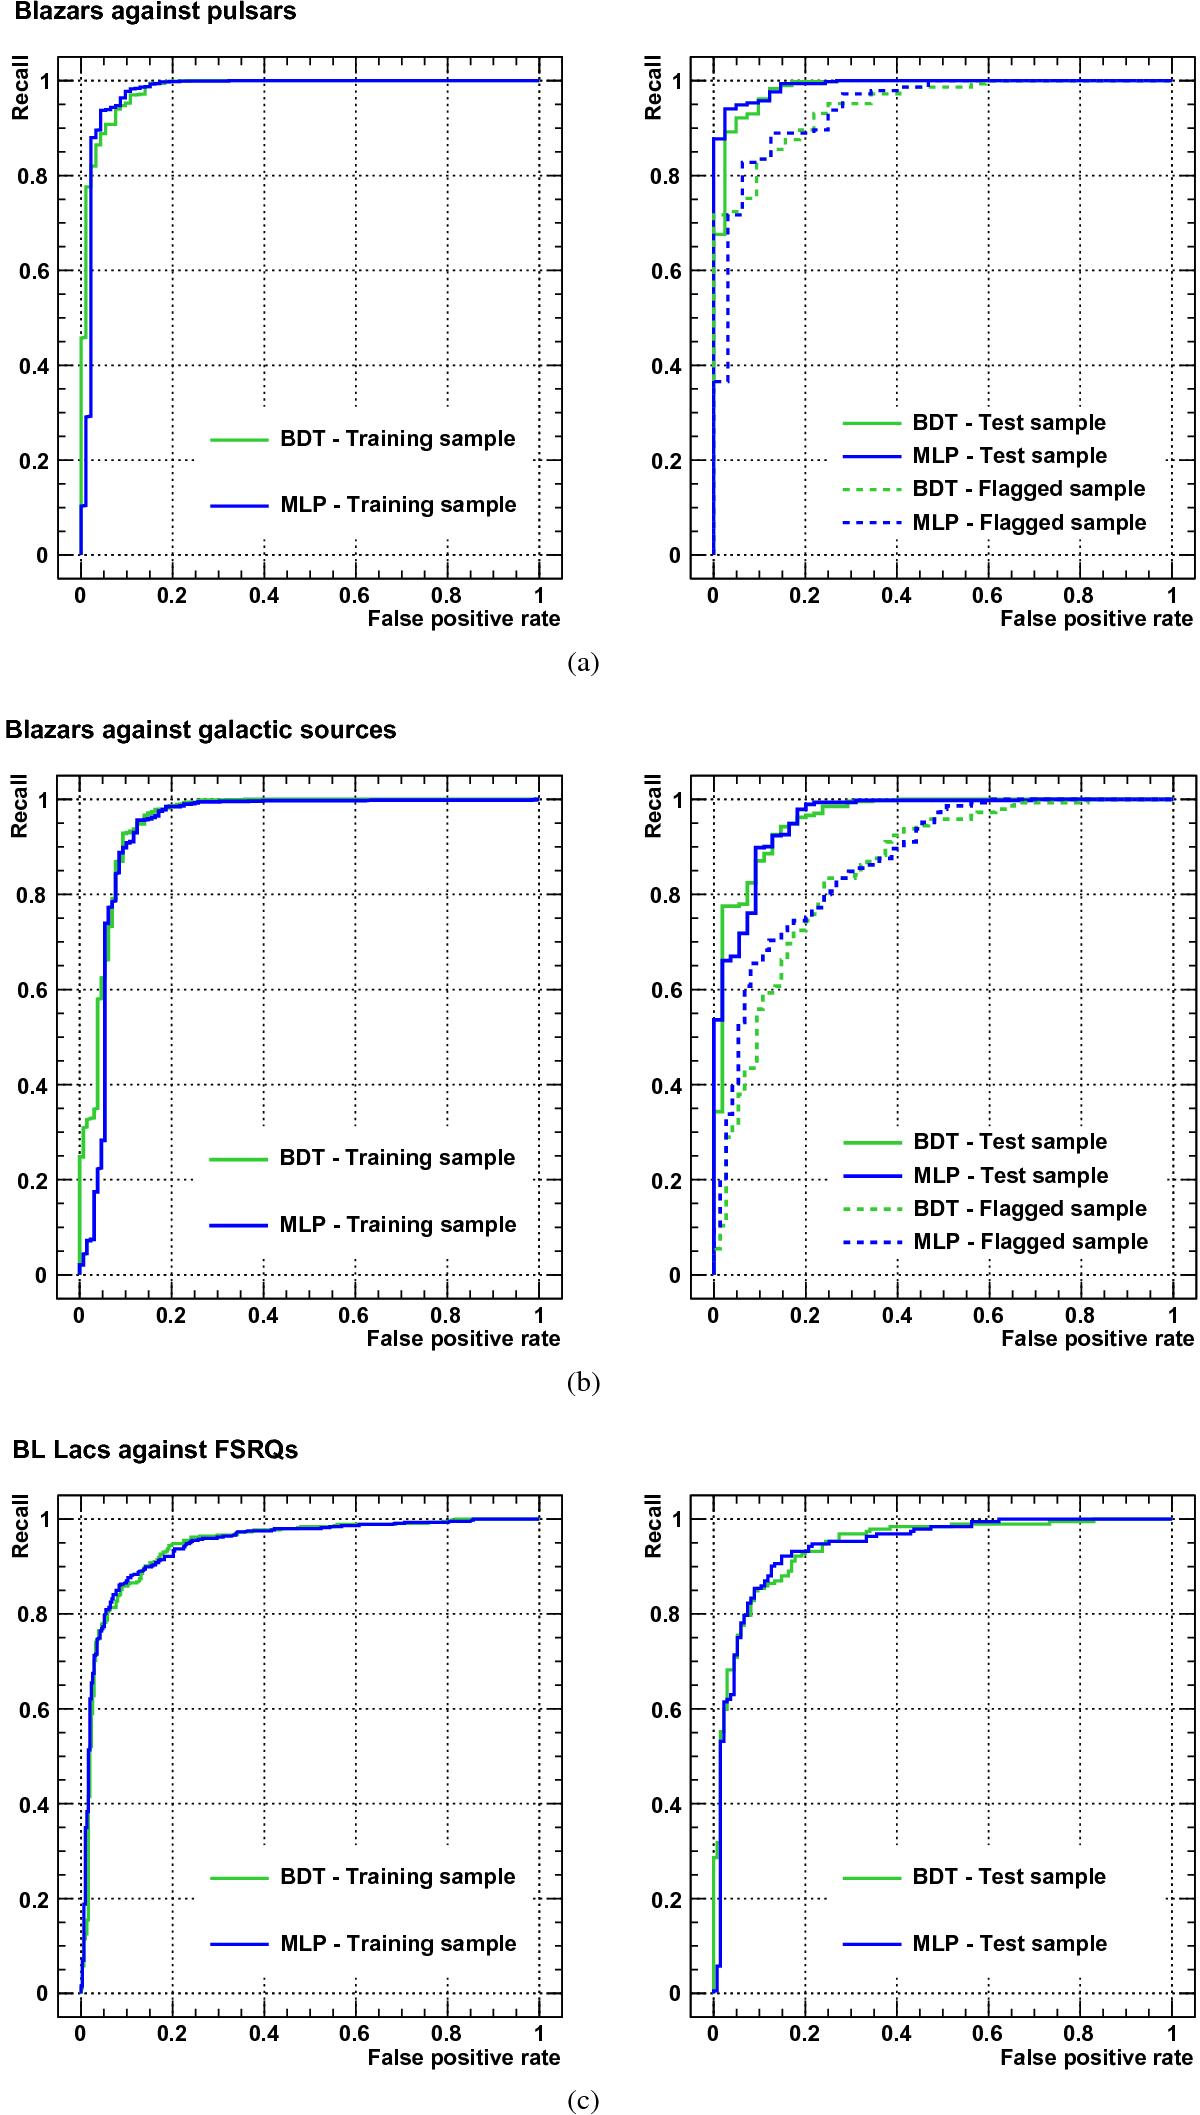
ROC curves for classifiers used in case A high galactic latitude a), case A low galactic latitude b) and case B c). In each case the left column shows the ROC curves (green for BDT, blue for MLP) obtained with the training sample using the ten-fold cross-validation method, as explained in Sect. 4.2. The right column shows the ROC curves obtained when applying classifiers to the test sample (solid line) or to the sample of labelled sources with flag (dashed lines).
Current usage metrics show cumulative count of Article Views (full-text article views including HTML views, PDF and ePub downloads, according to the available data) and Abstracts Views on Vision4Press platform.
Data correspond to usage on the plateform after 2015. The current usage metrics is available 48-96 hours after online publication and is updated daily on week days.
Initial download of the metrics may take a while.