Fig. 3
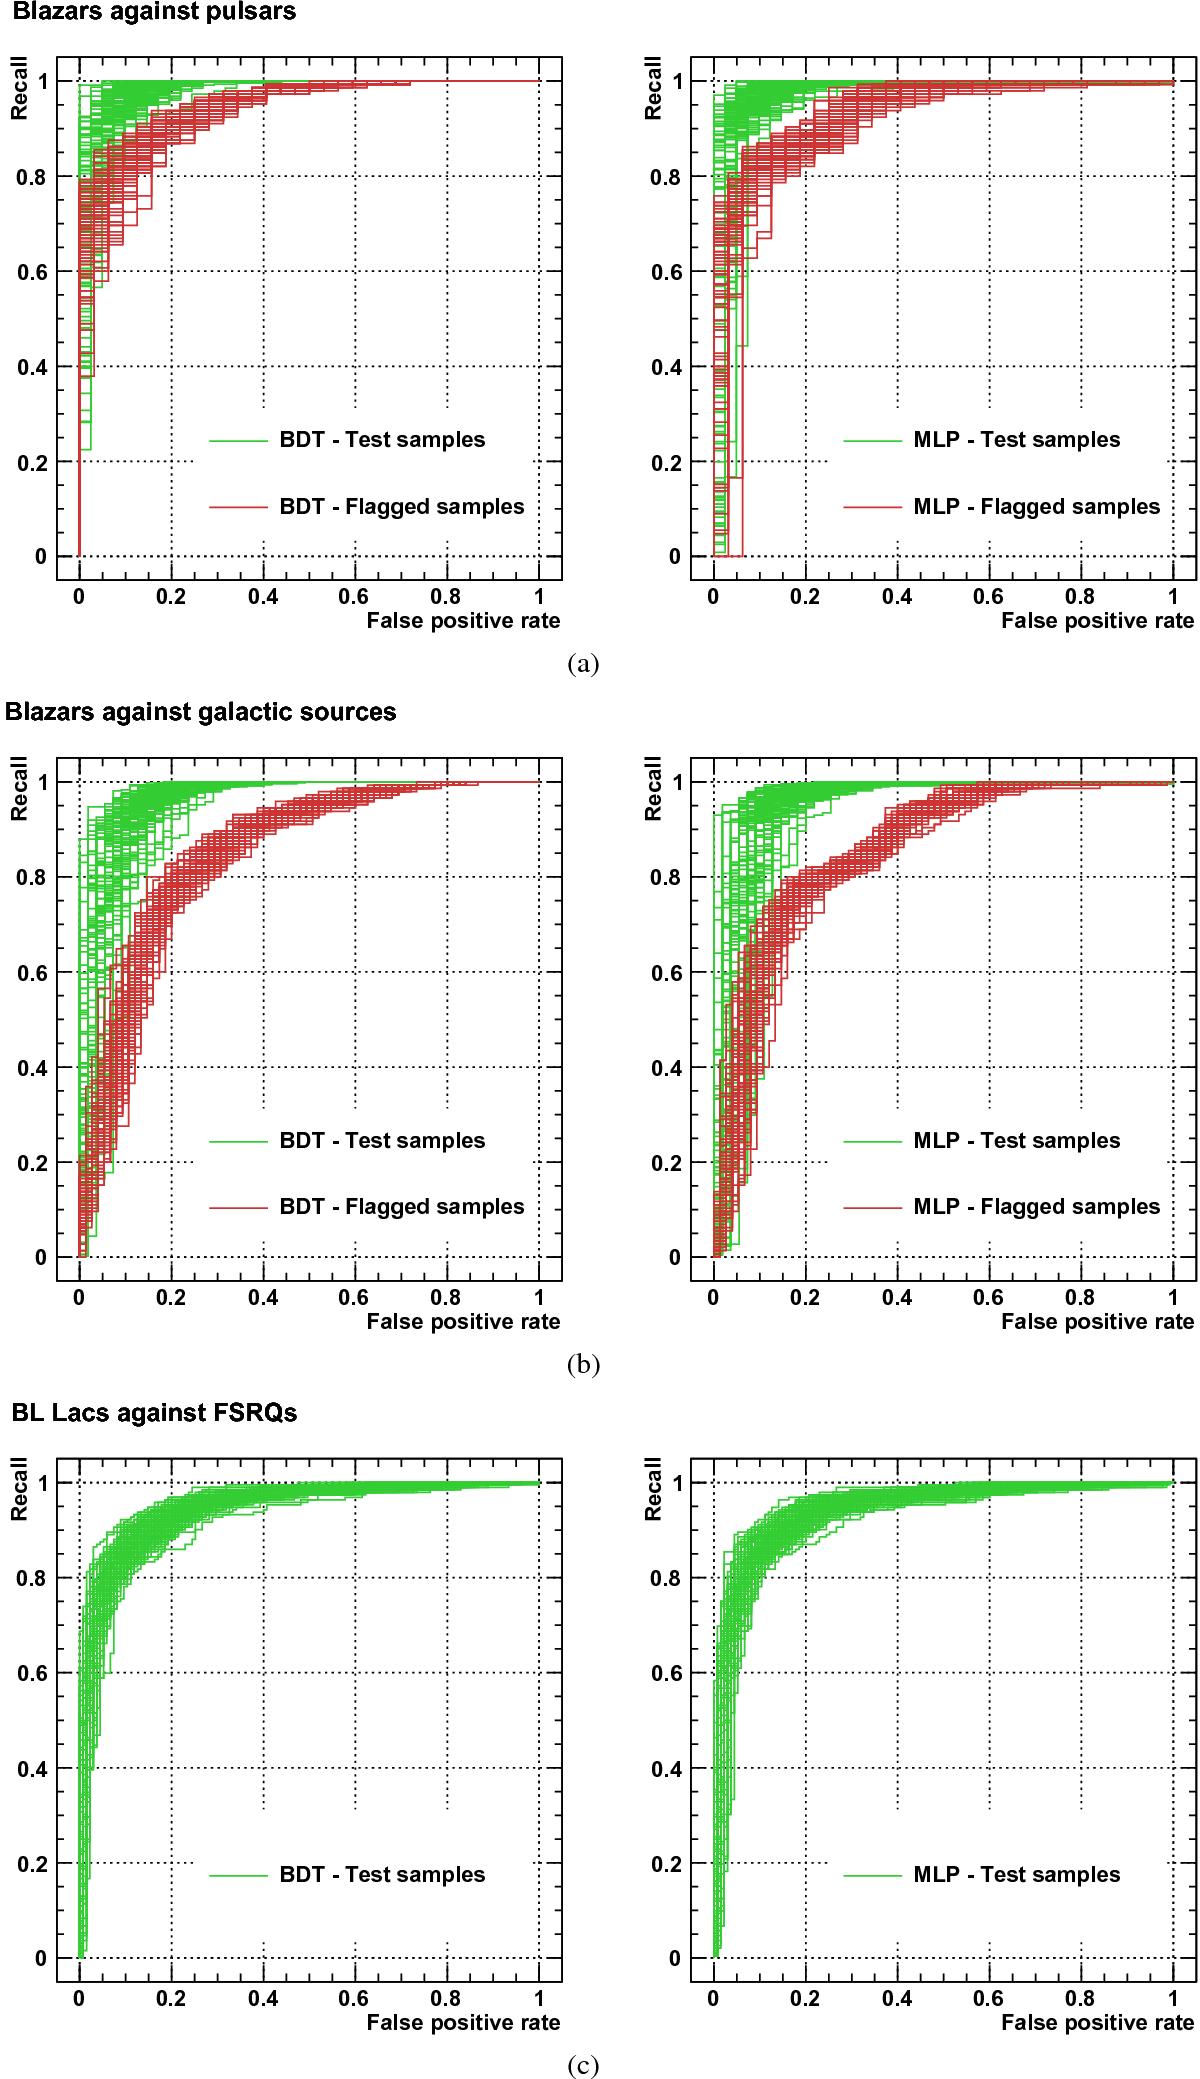
ROC curves corresponding to 100 random splittings of the samples of labelled sources (with no flag) used for classifier building. Performance for sources with no flag were estimated using the test samples (green curves). Specific performance for flagged sources were estimated using the samples of labelled sources with a flag (red curves). The left and right columns show respectively the results for the BDT and MLP classifiers. Results for case A high galactic latitude, case A low galactic latitude and case B are shown in rows a), b), and c), respectively.
Current usage metrics show cumulative count of Article Views (full-text article views including HTML views, PDF and ePub downloads, according to the available data) and Abstracts Views on Vision4Press platform.
Data correspond to usage on the plateform after 2015. The current usage metrics is available 48-96 hours after online publication and is updated daily on week days.
Initial download of the metrics may take a while.