Fig. A.3
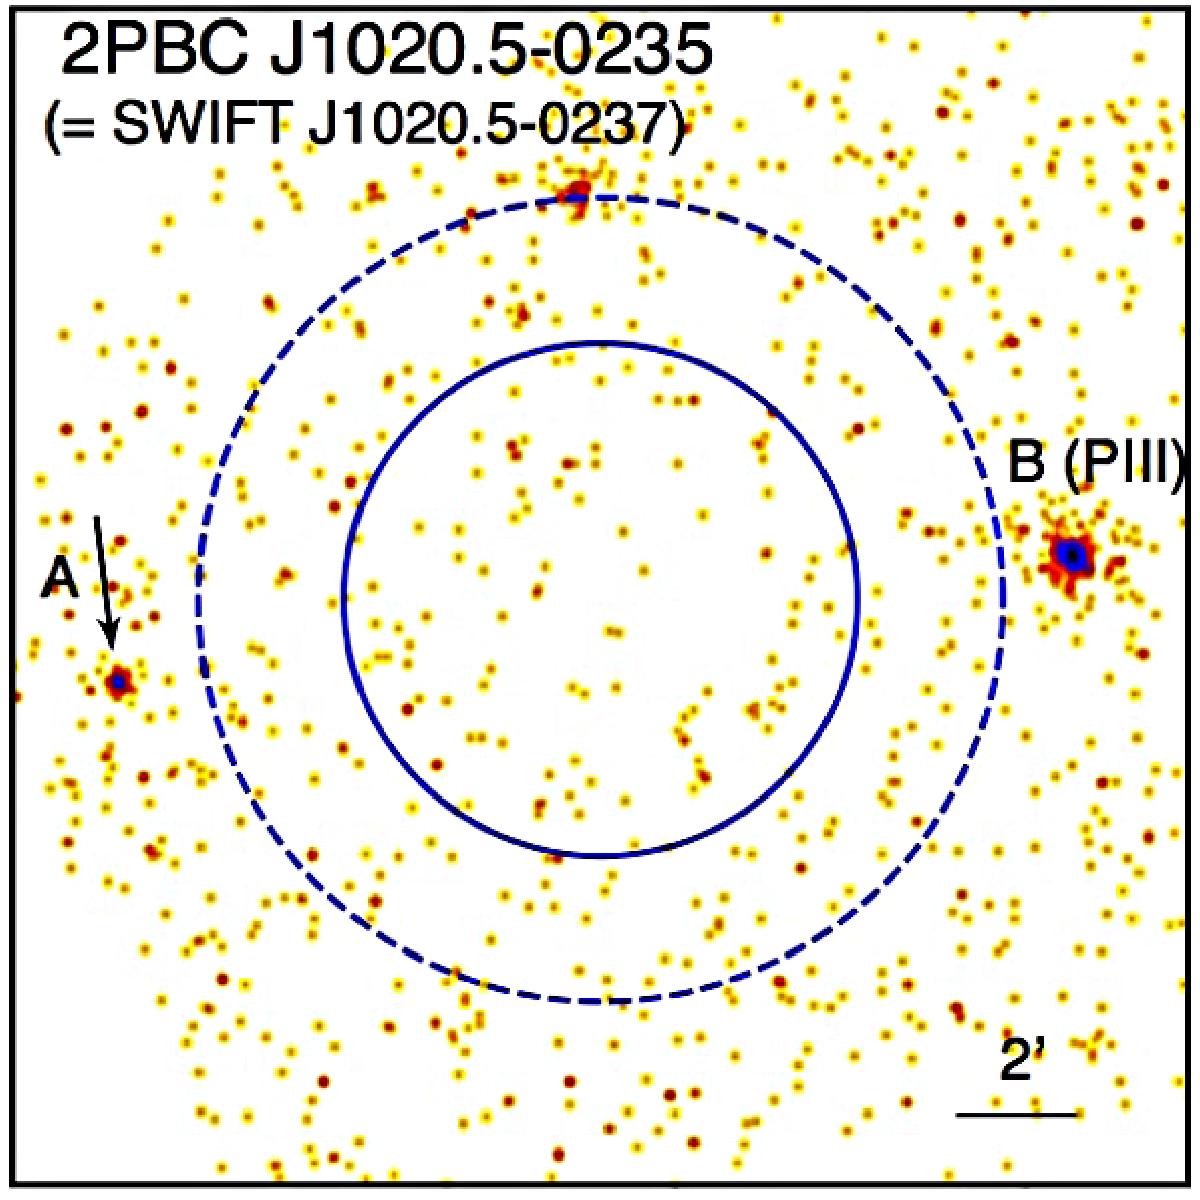
XRT soft X-ray observation of the field of 2PBC J1020.5−0235. The 90% BAT error circle is shown as a continuous blue line while the 99% error circle is indicated with a dashed blue line. The object for which optical spectroscopy was acquired is indicated with an arrow. Information on object B is presented in PIII. Field size is 20′× 20′. North is up and east to the left.
Current usage metrics show cumulative count of Article Views (full-text article views including HTML views, PDF and ePub downloads, according to the available data) and Abstracts Views on Vision4Press platform.
Data correspond to usage on the plateform after 2015. The current usage metrics is available 48-96 hours after online publication and is updated daily on week days.
Initial download of the metrics may take a while.