Fig. A.2
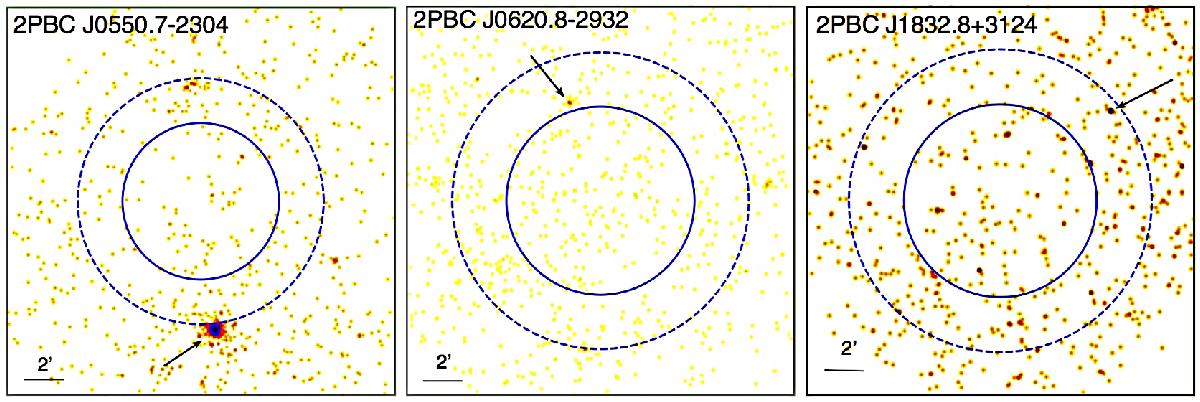
XRT soft X-ray images (0.3–10 keV) of the fields of 2PBC sources for which the corresponding soft X-ray counterpart is outside the 90% error BAT circle (continuous circle, in blue) and inside or at the edge of the 99% BAT error circle, indicated with dashed blue line. The counterpart identifications for which the optical spectra were acquired are indicated with arrows. Field sizes are 20′× 20′. In all cases, north is up and east to the left.
Current usage metrics show cumulative count of Article Views (full-text article views including HTML views, PDF and ePub downloads, according to the available data) and Abstracts Views on Vision4Press platform.
Data correspond to usage on the plateform after 2015. The current usage metrics is available 48-96 hours after online publication and is updated daily on week days.
Initial download of the metrics may take a while.